Gold Price Prediction: Veteran Analyst Warns Not Taking This Chart Seriously Will Be Your Biggest Financial Mistake


Gold has been on a great run, and it set fresh all-time highs near $5,500 earlier this year. This was all before entering a much-needed consolidation phase.
The metal currently trades around $4,100-$4,200. This was a pullback that has many investors questioning whether the bull market remains intact. Gold price prediction models remain different.
Some analysts see the recent correction as the beginning of a bigger drop. However, others view it as a routine pause within a larger secular advance.
One veteran analyst stands firmly in the second camp, and he wants investors to pay attention to a chart he first posted more than half a decade ago.
What you'll learn 👉
How the Analyst Called Every Major Gold Level Before It Happened
The analyst first published his gold chart five to six years ago. He also drew a black line through historical price action and mentioned a blue bullish rising wedge.
At the time, the market had little interest in the setup. Gold was trading far below what would later become key support levels.
His most important call centered on $1,673. While everyone focused on the $2,000 to $2,100 area as the major hurdle, he stated that $1,673 is the true breakout level.
Been saying for many years now that not taking this simple chart seriously would be the biggest financial mistake of your life.
— Graddhy – Commodities TA+Cycles (@graddhybpc) July 9, 2026
Posted this chart for the 1st time 5-6 years ago at black line backtest, saying it was most probably a blue bullish rising wedge.
Also been saying… https://t.co/Q1qJiukMki pic.twitter.com/ouCGd9yaeh
This wasn’t guesswork. The level was a structural boundary that would decide whether gold’s long-term trend remained intact.
The market slowly proved him right. Gold reclaimed $1,673 in 2020 and successfully retested that level during the 2021-2022 correction.
His silver calls followed a similar pattern. He identified $28.50 and $35 as key resistance levels while the crowd fixated on $50.
Silver hit resistance exactly where expected, but then something unexpected happened. It blew through $50 like the level didn’t exist. The breakout confirmed what the analyst had been saying all along.
Gold Chart Analysis
The long-term gold chart shows a secular continuation pattern rarely seen across major asset classes. A massive rising wedge developed over nearly fifteen years before resolving to the upside in 2024.
Bullish rising wedges remain rare in technical analysis. Most wedges break lower, which explains why so many analysts doubted the pattern.
But when bullish wedges resolve higher, they tend to produce explosive moves. That’s exactly what happened once gold broke above the upper boundary of the multi-decade consolidation.
Gold price prediction models based on pattern recognition now face an important question. Has the breakout completed its initial phase, or is the daily correction a normal pause before further gains?
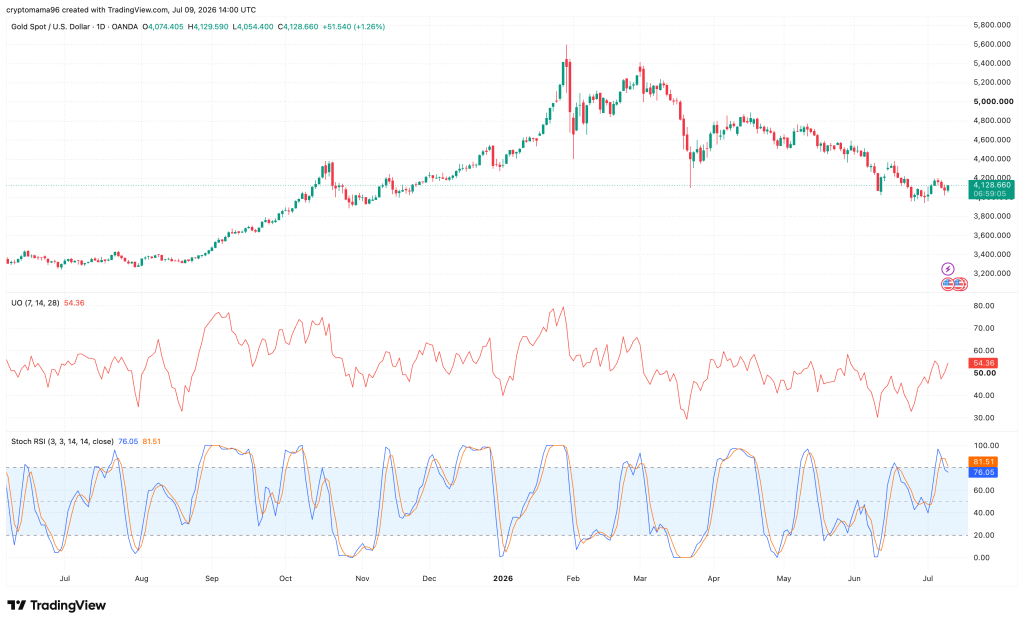
The daily chart shows gold trading around $4,125 and holds above psychological support at $4,000.
Momentum indicators are improving after months of weakness, with Williams %R recovering toward neutral territory and the Stochastic RSI moving back into overbought territory.
Immediate resistance sits between $4,250 and $4,350, followed by the $4,600-$4,800 zone. Above that lie the major swing highs near $5,500. On the downside, support levels stand at $4,000, $3,900, and $3,700-$3,750.
The $1,673 Blueprint: What the Crowd Got Wrong (And Still Does)
Before 2020, $1,673 was the upper boundary of nearly a decade of resistance. Every major rally failed before establishing stable price acceptance above it.
When gold finally broke through, many investors viewed the move as another false breakout similar to previous attempts. They expected a quick reversal and positioned accordingly.
Instead, the market did something far more important. It returned to the level during the 2021 and 2022 corrections and successfully defended it. From a technical view, that changed the former resistance into long-term structural support.
Crowd psychology tends to focus on recent price action and misses the bigger picture. Most investors looked at those corrections as the beginning of another bear market because prices had stopped making new highs.
Gold price prediction analysis must account for this psychology. Successful retests often matter more than the breakout itself.
They show that buyers are willing to defend higher valuations after enthusiasm fades. Once that retest succeeded, the probability of an eventual continuation increased.
Read also: “I Don’t Want to Buy Gold Here!” – Analyst Warns Gold Price Has Further to Fall
Gold Price Forecast: Is $48,000 Actually Possible?
The chart references a figure close to $48,000. This is the approximate level gold could reach if the U.S. dollar’s M2 money supply were fully backed by gold.
This comparison is illustrative rather than predictive. However, it provides a structure for understanding what kind of monetary environment would be required.
Several developments would need to occur simultaneously for gold price prediction models to approach such figures.
Persistent currency debasement is the most direct path. Decades of continued expansion in global money supply combined with physical gold supply growing only 1-2 percent annually would naturally push gold’s purchasing power higher.
Structural inflation rather than cyclical inflation would also be necessary. Temporary price spikes won’t justify such valuations.
Central bank reserve reallocation continues to increase. A more aggressive change from dollar-denominated reserves toward physical gold would tighten available supply. This can also increase institutional demand.
Even under optimistic assumptions, a move toward $48,000 would likely happen over many years rather than within a single market cycle.
What This Means for Gold Investors Before Year-End 2026
The shorter-term outlook remains more practical than the long-term discussion. For the rest of 2026, investors should focus on whether gold successfully builds support above the $4,000 region.
A move back above those levels would help for another attempt at the previous highs near $5,500. Failure to reclaim resistance could expose the market to a deeper pullback toward the $3,700-$3,750 area.
Macro data is also equally important. Federal Reserve interest-rate expectations continue to drive short-term price action.
U.S. real yields, dollar strength, central bank gold purchases, inflation expectations, wage growth, and geopolitical developments will all influence the next major directional move.
The sector is in a much-needed and expected pullback. The huge bearish candle so far this year needs to change before year-end, or the market could be looking at a blue backtest.
Frequently Asked Questions
Subscribe to our YouTube channel for daily crypto updates, market insights, and expert analysis.