There is finally some relief on the market. Ethereum price pumped 6% in the past day and is now well above $1,700 for the first time in over a week. Bitcoin reclaimed $61,000. Altcoins are bouncing across the board.
But CryptoQuant posted an interesting report today about altcoin sell pressure hitting a multi-year low again. The data is worth understanding.
What you'll learn 👉
What the Chart Measures
The orange area on the CryptoQuant chart is the 1‑Year Cumulative Buy/Sell Quote Volume Difference for altcoins excluding Bitcoin and Ethereum. Every market buy adds positive value. Every market sell subtracts value. CryptoQuant accumulates the difference over an entire year.
This is net spot buying versus net spot selling across major altcoins. It is not price. It is not futures. It is not market cap. It is measuring whether spot traders are primarily buying or selling.
Reading the Chart
From 2020 to 2021, the orange line stayed near zero and occasionally turned positive. Bitcoin price rallied, altcoins exploded, and buyers consistently absorbed supply. That was a healthy bull market.
During the 2022 bear market, the orange line slowly trended lower. More selling than buying. Nothing surprising there.
In 2023, Bitcoin recovered strongly but the orange line barely improved. Money preferred BTC. Most alts underperformed badly. This matched reality – 2023 was almost entirely Bitcoin, AI coins, and a few narratives.
In early 2024, Bitcoin climbed and the orange line improved somewhat but remained negative. Again, money favored Bitcoin.
Then 2025 happened. This is where things become extreme. The orange line did not simply decline. It almost fell vertically. Every month, spot sellers overwhelmed buyers. Not for weeks. For months. That is unusual.
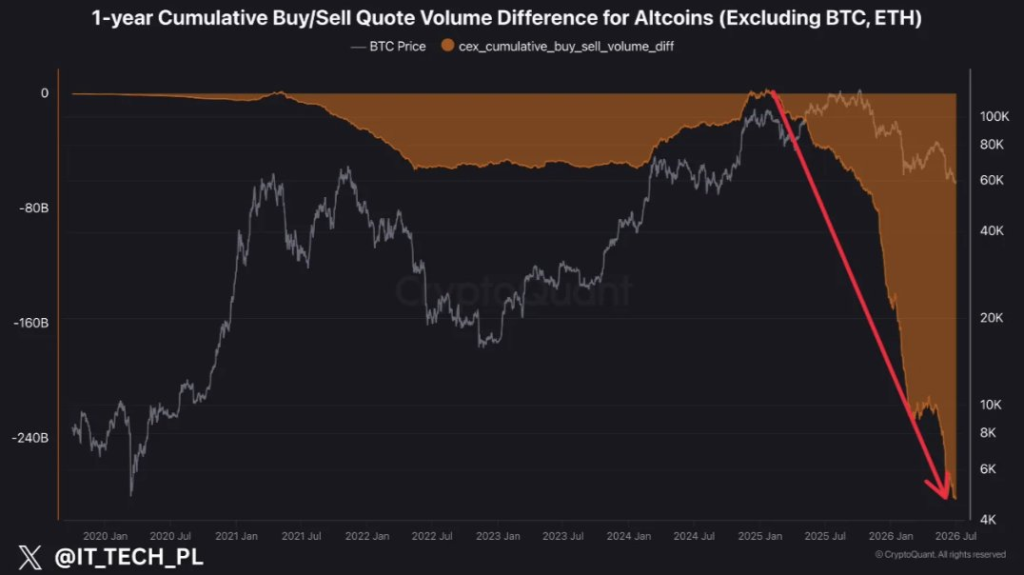
Imagine every day there is $120 million in buys and $170 million in sells. The net is -$50 million. Repeat that every day. Eventually the cumulative difference becomes enormous. That is what this chart is showing.
The indicator is now lower than the 2022 bear market, lower than 2023, and lower than 2024. Spot sellers are more aggressive now than during much of the previous bear market. That deserves attention.
The red trendline on the chart shows that instead of higher lows or flattening, the indicator accelerated downward. No sign yet that buyers are matching sellers. That is why CryptoQuant wrote: “No bounce. No pause. Just distribution.”
The Important Nuance
This does not automatically mean altcoins must crash further. Cumulative indicators are often lagging. Suppose 100 investors panic sell while institutions quietly buy over‑the‑counter. Spot cumulative flow remains negative, yet price stabilizes. The indicator still looks awful, but the market has already bottomed.
Negative cumulative flow does not guarantee future price decline.
Is this capitulation? Possibly. Extreme readings often appear near important lows. After months of losses, broken narratives, ETF focus on BTC, meme coin rotation, and poor liquidity, retail finally gives up. That is exactly when cumulative selling becomes most negative. Ironically, that can be bullish later.
Possible Interpretations
Scenario 1 (Bullish): This is late‑stage capitulation. Everyone who wanted to sell has already sold. Remaining supply becomes scarce. Eventually, small buying creates large price moves. Historically, this often precedes strong rallies.
Scenario 2 (Neutral): Bitcoin dominance remains high. Money continues flowing into BTC. Altcoins remain weak. Some projects outperform, but most do not. This has actually been the dominant theme since late 2023.
Scenario 3 (Bearish): Selling continues. Liquidity keeps leaving. Bitcoin corrects. Altcoins experience another leg down. This would likely push many lower‑quality alts to new cycle lows.
Why Are Altcoins Crashing in 2026?
- The post‑halving cycle played out almost exactly like previous cycles – Historically, Bitcoin tends to halve, rally for 12‑18 months, blow off a top, and then enter a 12‑18 month bear market. The 2024 halving was followed by massive ETF inflows, institutional buying, Bitcoin reaching roughly $126,000, and an altcoin rally. Then profit taking began. Markets do not go up forever.
- ETF flows reversed – This is probably the biggest structural change. In 2024‑2025, spot Bitcoin ETFs were buying enormous amounts of BTC. That created constant demand. Now the opposite is happening. Recent reports show billions of dollars have flowed out of Bitcoin ETFs. Major institutions are no longer adding aggressively. Citi even reduced its expected ETF inflows from +$10 billion to essentially zero because demand weakened. When ETFs stop buying, the biggest buyer disappears.
- Liquidity left crypto – Crypto is fundamentally a liquidity‑driven market. When lots of money is available, people buy BTC, then ETH, then altcoins, then meme coins. When liquidity shrinks, the process reverses. People sell the riskiest assets first. Altcoins are usually first to suffer.
- Money rotated into AI instead – This has been one of the defining themes of 2026. Instead of buying crypto, many institutional investors preferred AI companies, semiconductor stocks, and major tech IPOs. Reuters reports that capital has rotated away from crypto toward AI‑related investments, while Bitcoin ETF flows have turned negative. If you are managing a large portfolio and AI is returning 40‑80% while crypto is falling, reallocation is the logical move.
- Higher interest rates and macro conditions – Crypto performs best when borrowing is cheap, liquidity is abundant, and investors are comfortable taking risk. Instead, markets have faced persistent inflation concerns, reduced expectations for rate cuts, and tighter financial conditions. Risk assets – including crypto – have struggled under that backdrop.
- Retail disappeared – The CryptoQuant chart illustrates this clearly. For over a year, spot selling has exceeded spot buying. People have slowly been exiting. No panic. Just continuous selling. Exactly what bear markets look like.
Subscribe to our YouTube channel for daily crypto updates, market insights, and expert analysis.