
Bitcoin price has spent months under pressure, and fresh analysis now points to the possibility that the decline may not be over. Several market commentators are comparing the current BTC structure with previous bear market cycles. Their message is surprisingly similar, even though they rely on different methods.
That does not mean Bitcoin must follow one exact path. Every cycle brings new conditions, and history never repeats perfectly. Even so, the latest charts raise an important question. Could BTC price still have one more major move lower before the next bull market begins?
Crypto analyst cyclop, known on X as @nobrainflip, believes the current Bitcoin price cycle still needs more time before a lasting bottom appears.
🚨 MOST PEOPLE AREN'T READY FOR WHAT HAPPENS BELOW $58K
— 𝗰𝘆𝗰𝗹𝗼𝗽 (@nobrainflip) June 30, 2026
I’ve been trading crypto for 9 years and have never seen anything like this
Everyone is screaming that bottom is in, or we're going to 30k, but it won't be either of these
Reversals never happen without shaking out… https://t.co/RbKI2qNuEz pic.twitter.com/I4amKT95ZT
His base case expects BTC to spend much of the summer trading within a range before slipping toward the low $50,000 region. Another drop toward about $42,000 could follow after that. His view does not expect Bitcoin to reach $30,000 even though many market participants continue watching that level.
Cyclop explained that major market bottoms rarely appear after a single sharp drop. Previous Bitcoin cycles often spent months moving sideways before the next major rally began. Those extended periods made investors question whether the market had reached its lowest point.
He also argued that chart patterns should always match broader market conditions. Once a pattern no longer fits reality, he believes it should no longer guide investment decisions.
One interesting point from his analysis focuses on psychology instead of technical indicators. He noted that many investors waited for even cheaper prices during previous bear markets. That hesitation caused many to miss strong buying opportunities after Bitcoin reached its lows.
What you'll learn 👉
Bitcoin Cycle Models Continue Pointing Toward A Late 2026 Reversal
Another analyst, Pepesso (@0xPepesso), reached a similar conclusion through a completely different model.
His research focuses on Bitcoin’s historical market cycle clock. Every completed cycle has followed a similar pattern of about 365 days in a bear market followed by approximately 1,064 days during the next bull phase.
🚨 $BTC IS LITERALLY COPY-PASTING 2022 setup
— Pepesso (@0xPepesso) June 29, 2026
Just look at the chart:
Left side – 2022:
> $69K peak, descending channel, final flush to $15K. Then the biggest run in BTC history followed
Right side – 2026:
> $126K peak, same descending channel, same structure. Sitting at $59K… https://t.co/qQ8w7RafVZ pic.twitter.com/unH1HcAVUK
Pepesso believes the current cycle remains close to that historical timeline. Since the market is only about 252 days into the present bear phase, he expects another 110 days before conditions become favorable for a larger recovery.
His outlook places the final accumulation period later this year. That timeline also matches his view that Bitcoin price remains attractive below $59,000 for gradual buying over time.
Pepesso also shared another chart that compares today’s BTC price structure with the 2022 bear market. A look at his comparison shows both cycles forming similar descending channels after reaching major highs.
His analysis points to about $49,000 as the area where Bitcoin could complete one final selloff before beginning the next major advance.
Read Also: RLUSD Just Became the Most‑Traded Asset on XRP – And Every Trade Burns XRP
Key Price Levels Mentioned By The Analysts
- Cyclop expects Bitcoin price to range before moving toward $50,000, with a possible final flush near $42,000.
- Pepesso believes the historical cycle points to another 110 days before conditions improve.
- Pepesso identifies $49,000 as a possible final bottom if the 2022 structure repeats.
- Both analysts believe the strongest recovery may begin after the final phase of the current bear market.
Our Bitcoin Price Analysis Points to a Similar Conclusion
Our own Bitcoin price analysis also supports the idea that the market may not have reached its final bottom.
A look at Bitcoin’s long term chart shows that BTC price has followed the same broad pattern during the past two market cycles. Each major bear market eventually bottomed after touching a long term ascending trendline that has guided Bitcoin’s growth for years.
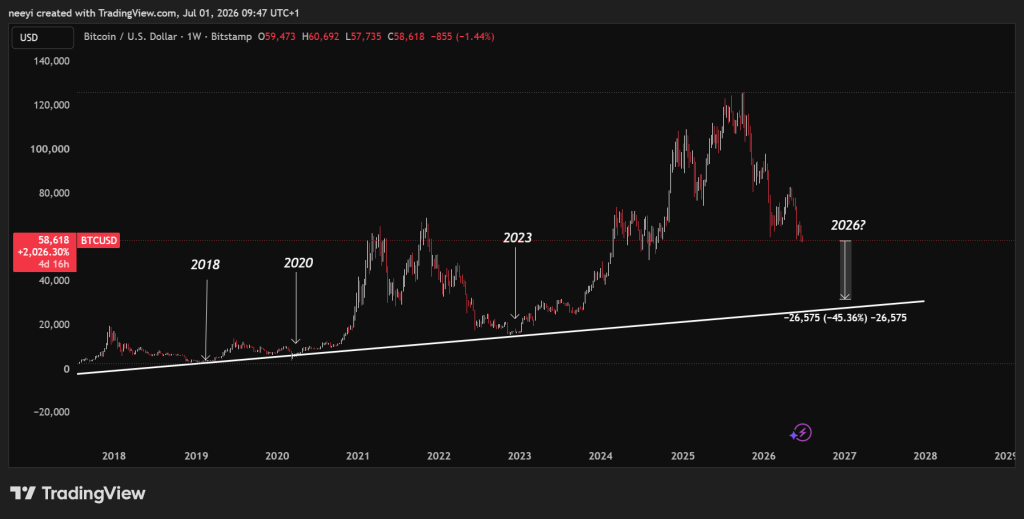
If that historical pattern repeats once again, the next major Bitcoin price bottom could arrive somewhere between $30,000 and $35,000. That level also falls close to where the long-term trendline is expected to meet price over the coming months.
History does not guarantee the same outcome every cycle, and Bitcoin could break away from this pattern at any time. Even so, the chart continues to point toward the possibility that another meaningful decline could happen before the next bull market begins
Bitcoin price has surprised both bulls and bears many times throughout its history. Current charts may continue to point lower, although history also shows that major bottoms usually become obvious only after they have already formed.
FAQs
Subscribe to our YouTube channel for daily crypto updates, market insights, and expert analysis.