The HYPE price is trading around $57.55 after a 16.55% jump in 24 hours, and that move has pushed it right under its all-time high near $59.39. It’s now sitting in a zone where one more push could open up new highs, but the speed of the move also makes the current area very sensitive.
Bitcoin stayed mostly flat over the same period, so this wasn’t a market-wide move. HYPE clearly separated itself from the broader crypto market, which makes the current structure even more interesting to watch.
What you'll learn 👉
How the HYPE Price Broke the $48–$50 Wall
We had a look at the chart shared by Sjuul, and the breakout started once the HYPE price pushed through the $48–$50 zone. That level had blocked every recovery attempt for weeks, acting like a hard ceiling.
Once buyers finally cleared it, price moved quickly toward the high-$50s without much hesitation. Crypto analyst Sjuul pointed out that this zone was the final major resistance before price entered a possible expansion phase.
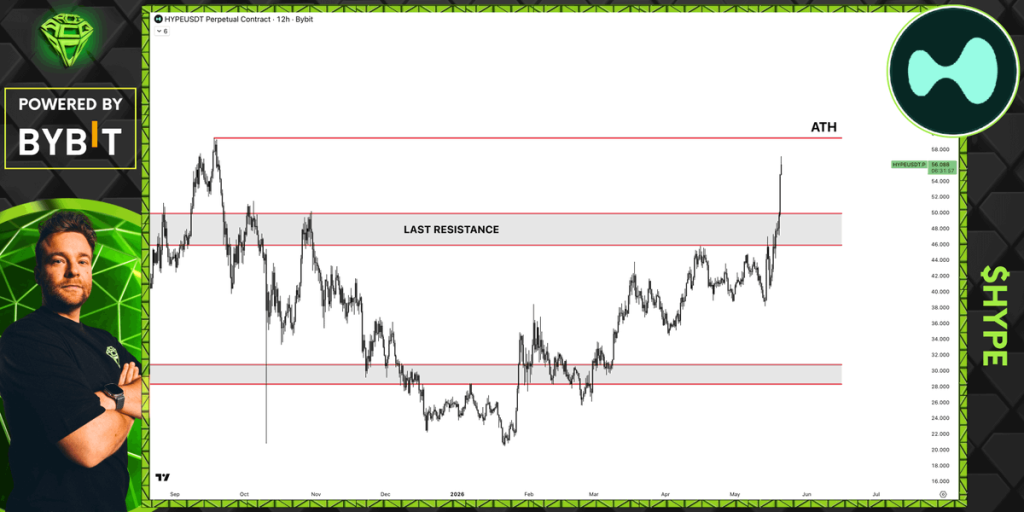
The bigger picture still matters here. Earlier in the cycle, HYPE dropped from the $58+ area down to roughly $22–$24 during a long correction phase that ran through late 2025 into early 2026. From that low, price has now recovered more than 130%–150%, which explains how quickly sentiment flipped.
The structure now shows a clean pattern of higher highs and higher lows, and that’s usually what traders want to see during strong trending moves. The old resistance around $48–$50 is now acting as the first support zone after the breakout.
What Is Driving the HYPE Price Move
One of the biggest drivers behind the HYPE price rally is a short squeeze. Earlier positioning data showed heavy bearish bets in the system, and when price started moving higher, those positions were forced to close.
That led to roughly $30.6 million in short liquidations within 24 hours, which added fuel to the move toward $57–$58. When forced buying hits an already rising market, the price can move faster than expected.
There’s also growing attention around ETF inflows tied to Hyperliquid. Combined net inflows have reached about $25.5 million shortly after launch, adding steady demand rather than just short-term trading activity.
2/ $HYPE (Hyperliquid) The on chain trading beast
— The Great Mattsby (@matthughes13) May 20, 2026
L1 built for perps and spot: 200k TPS, fully on chain orderbooks, sub second finality.
Record OI ($2B+), tokenized RWAs (S&P perps etc), EVM layer.
97% of fees go to buy and burn HYPE. Real revenue = real tokenomics.
Up…
On top of that, Hyperliquid’s ecosystem continues to show strong activity. Open interest sits above $2 billion, and the platform routes about 97% of fees into buying and burning HYPE as reported by The Great Mattsby. That creates a direct connection between usage and token demand, which traders are paying attention to.
Read Also: Here are 5 Stocks BlackRock Is Buying Now
Where HYPE Stands and Where It Could Go
We had a look at the structure, and HYPE is now pressed right against the all-time high at $59.39. This is the level that separates a strong breakout from full price discovery.
If buyers manage to push through that level cleanly, the next area traders are watching sits between $65 and $75 based on previous breakout projections. That would mark a continuation of the current trend rather than just a temporary spike.
On the other hand, the key support zone is now between $52 and $50. That area used to act as resistance, and it’s now the line that needs to hold if the breakout is going to stay valid. If that zone fails, the HYPE price could slip back toward $47–$44, where earlier consolidation took place during the recovery phase.
Right now, the HYPE price is at a point where direction depends on whether momentum continues or cools off. ETF inflows and short squeeze conditions have played a big role in the move so far, but those factors don’t stay constant.
FAQS
Subscribe to our YouTube channel for daily crypto updates, market insights, and expert analysis.