The crypto market is mostly boring today; Bitcoin price chopping near $76K, altcoins flat. But Algorand (ALGO) bucked the trend. The price pumped 8%.
The main reason is a major exchange listing. Let’s break down what happened with Algorand and what the ALGO chart says.
What you'll learn 👉
Why Is ALGO Price Up? Robinhood Lists ALGO for US Users – The Main Catalyst
On May 19, Robinhood announced that ALGO is now available to trade on Robinhood Crypto for all US users, including New York.
This is a big deal. Robinhood has millions of retail users who previously could not buy ALGO on the platform. New York has strict BitLicense requirements, so approval there signals regulatory confidence. The listing opens ALGO to a massive new pool of retail liquidity.
$ALGO is finally available for @RobinhoodApp users in the U.S 🇺🇸 https://t.co/ot3Qh77wjZ
— Algorand Foundation (@AlgoFoundation) May 19, 2026
Other Algorand news – HermesVault hack
The Algorand-based privacy protocol HermesVault permanently shut down after a hacker exploited a flaw in its withdrawal logic, stealing 261,000 ALGO (worth roughly $29,466).
Most funds were recovered, but the incident underscores implementation risks in auxiliary smart contract code, even for protocols using robust zero-knowledge circuits.
This news is negative but small in scale — the Robinhood listing completely overshadowed it.
Algorand Chart Analysis (2-Hour)
We took a look at the ALGO/USDT 2-hour chart from CoinAnk. Here’s what the data shows.
Algorand Price action
The ALGO price broke out from a consolidation range between $0.108 and $0.115.
The candle before the pump showed a low of $0.114 and a high of $0.118. Current price sits at $0.1158.
The amplitude is 3.46%, which is moderate for an altcoin pump. The move came on higher volume, which actually indicates genuine buying interest rather than a low-volume wick.
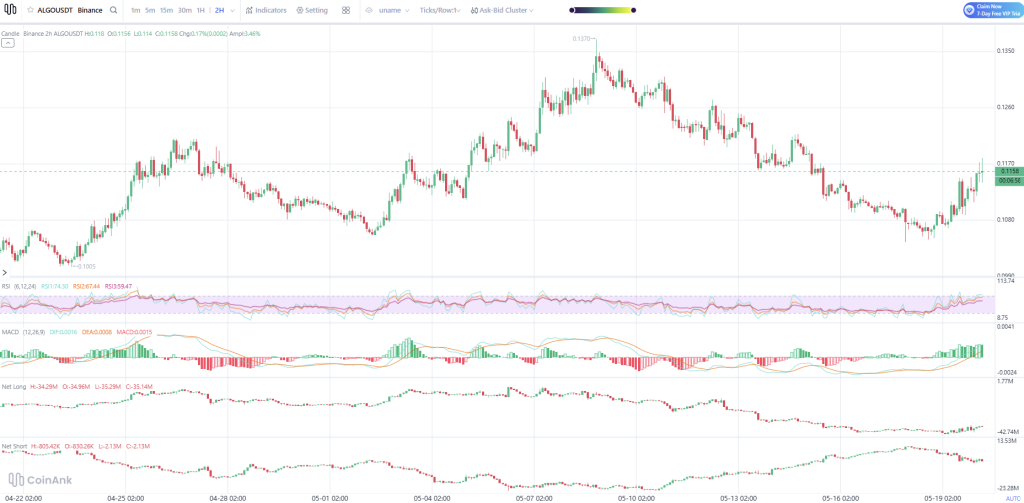
The Algorand chart shows three RSI values: RSI1 at 74.30, RSI2 at 67.44, and RSI3 at 59.47. The primary RSI (likely the 6-period) sits at 74.30, which is deep into overbought territory. That means the recent pump is overextended in the short term, making a pullback or consolidation likely soon.
The MACD indicators remain bullish. The DIF (fast line) is at 0.0016, the DEA (slow line) is at 0.0008, and the histogram (MACD) is at 0.0015. The MACD line remains above the signal line while the histogram stays positive, which confirms bullish momentum. However, the gap between the lines is not extremely wide, which means momentum is strong but not yet parabolic.
Net Long positions currently sit at -35.14M, while Net Short positions are at -2.13M. Both values being negative indicates the market remains overall short-biased. This likely means many traders were positioned against the move, and the sudden pump may have triggered a short squeeze that amplified the rally.
The pump may have caught many shorts off guard, causing a short squeeze that amplified the move.
ALGO Price: Support and resistance zones:
Support:
- $0.108 (previous range low)
- $0.10 (psychological support)
Resistance:
- $0.126 (local high)
- $0.135
- $0.137 (recent peak)
Related Algorand analysis: 12 Signals That Suggest ALGO’s Moment Could Be Close
Algorand Price Predictions (7–10 Days)
Below are our current Algorand price predictions:
🐂 Bullish scenario
ALGO holds above $0.115 and breaks $0.126 with volume.
Robinhood retail inflow continues.
Next targets: $0.135, then $0.137.
A daily close above $0.14 would confirm a trend reversal.
🐻 Bearish scenario
RSI overbought triggers profit-taking.
ALGO drops back below $0.11, retesting $0.108 support.
If that breaks, next stop is $0.10.
Low volume and broader market weakness could accelerate the pullback.
⚖️ Likely scenario
Range trading between $0.11 and $0.126 for the next few days.
The Robinhood listing provides a bid, but the RSI at 74 needs to cool off.
Expect a pullback to $0.112–$0.115, then another attempt at $0.126.
The move is real but not a moonshot.
Overall, Algorand pumped 8% after Robinhood added ALGO for all US users, including NY.
The chart shows an overbought RSI at 74 but a bullish MACD. Net shorts dominate, so a short squeeze may have helped.
Resistance sits at $0.126, support at $0.108.
Short-term pullback likely, but the listing brings new retail liquidity.
Watch $0.115 as the pivot.
FAQs
Subscribe to our YouTube channel for daily crypto updates, market insights, and expert analysis.