Polkadot (DOT) Down 98% from ATH, But Analyst Says This Zone Could Be the Best Entry of the Cycle
The DOT price is down 98% from its all time high near $55. The token has been crushed. But Crypto Patel sees something different. He says the same structure that preceded a 4,000% rally is back. The multi-year descending channel is compressing near demand.
The macro accumulation zone is $1 to $1.20. The DOT price is near $1.25. The targets are $2, $5, $10, $20, and a bonus $50. That is a 4,000% move from the accumulation zone. The invalidation is a weekly close below $0.90. Patel says channel compression plus high timeframe demand plus macro accumulation is where major cycle reversals begin.
What you'll learn 👉
What the DOT Weekly Chart Shows
We had a look at the DOT weekly chart from Crypto Patel, and the price is trading at $1.251, up 0.89% on the week on volume of 19.64 million. The chart shows a brutal downtrend from the $55 all time high.
The DOT price has been making lower highs and lower lows for years. The chart shows a multi-year descending channel that is compressing near a high timeframe demand zone. That is exactly where major reversals have started before.
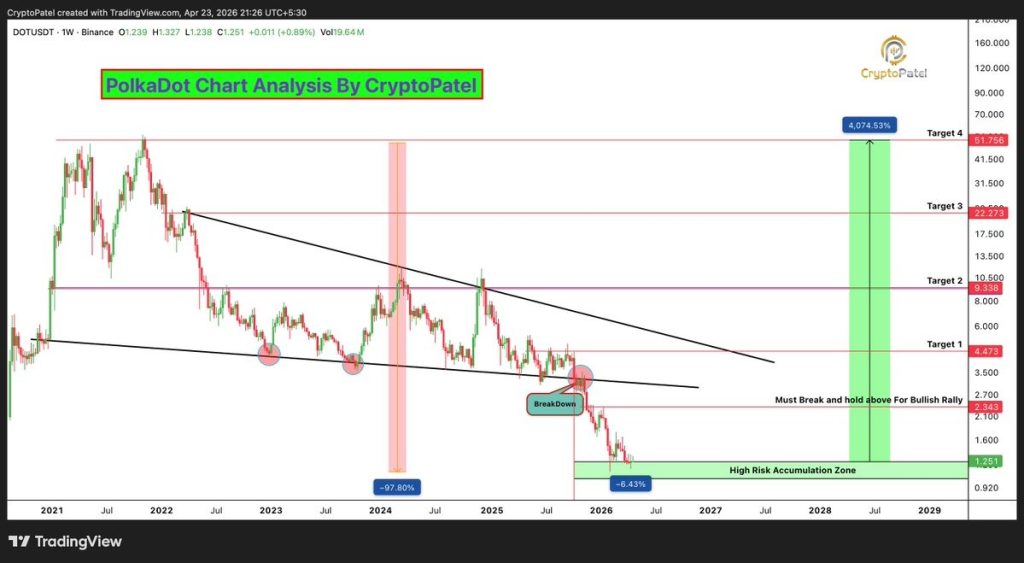
The accumulation zone is marked between $1.20 and $1. The DOT price is sitting right in that zone. The invalidation level is a weekly close below $0.90. Below that, the setup fails. Above that, the path to the targets opens.
The first target is $2. That is a 60% move from current levels. Then $5, then $10, then $20, then the bonus $50. That is a 4,000% move from the accumulation zone. The chart from previous cycles shows that the same structure led to a massive rally. Patel is betting that history repeats.
The Tokenomics Shift That Changes Everything
Polkadot enacted its most significant economic change in March 2026. A hard cap of 2.1 billion DOT was implemented, and annual token issuance was cut by roughly 53%, from 120 million to 55 million DOT.
This “halving” event shifts DOT from an inflationary to a disinflationary asset. Reduced new supply is price supportive. It introduces a scarcity mechanism similar to Bitcoin’s halving. The 21Shares Polkadot Spot ETF launched on Nasdaq on March 6, 2026, providing a regulated wrapper for institutional capital.
However, demand has been muted so far. The ETF saw 27 days of zero flows before a minor inflow on April 9. The infrastructure is there. The demand is waiting.
Read Also: Grok AI Delivers a Stunning XRP Price Prediction for 2035
Where the DOT Price Goes From Here
The DOT price is at $1.25. The accumulation zone is $1.20 to $1. The invalidation is $0.90. The first target is $2. Then $5, $10, $20, and $50. The weekly chart shows a descending channel compressing near demand.
The DOT price is down 98%. That is the discount. Patel says this is the best entry for 2026 to 2027. The same structure before a 4,000% rally is back. The DOT price is the only thing left to prove him right or wrong.
Subscribe to our YouTube channel for daily crypto updates, market insights, and expert analysis.