
Bitcoin Price News: BTC Hits $78K as ETF Inflows Extend to 6 Days – But KelpDAO Hackers Launder $33M

Bitcoin moved back to $78,000 today as fresh ETF inflows returned to the market. That recovery came at a time when global uncertainty remained elevated, and a major laundering event added a different kind of pressure beneath the surface.
The mix of steady institutional demand and suspicious on-chain activity now shapes what could happen next for BTC price.
Data shared by Wu Blockchain shows that Bitcoin spot ETFs recorded a net inflow of $11.8442 million on April 21. That figure marks a sixth consecutive day of positive flows, which gives the current rally a stronger foundation than earlier attempts.
According to SoSoValue, on April 21 (ET), Bitcoin spot ETFs saw a total net inflow of $11.8442 million, marking a 6-day streak, while Ethereum spot ETFs recorded $43.3589 million in net inflows, continuing a 9-day streak. pic.twitter.com/jikOSf6BOk
— Wu Blockchain (@WuBlockchain) April 22, 2026
Ethereum ETFs also posted inflows of $43.3589 million over a nine-day period. Capital does not appear to be rotating out of crypto. Instead, it suggests a broader appetite across major assets.
That steady inflow trend often acts as a support layer for Bitcoin price. Sustained ETF demand can help absorb sell pressure during uncertain periods. This current streak, even though modest in size, arrives at a time when BTC is testing a level that previously rejected price multiple times in recent months.
What you'll learn 👉
Geopolitical Developments Add Uncertainty To Bitcoin Market Direction
Another factor influencing Bitcoin price comes from global political developments. A statement shared by Donald J. Trump indicated that the United States may delay a planned escalation involving Iran. The decision allows time for internal negotiations within the Iranian government while maintaining military readiness.
Trump: U.S. to extend ceasefire pending talks on Iran
— Wu Blockchain (@WuBlockchain) April 21, 2026
Donald J. Trump stated that, citing significant fragmentation within the Iranian government, the United States will hold off on its planned attack on Iran to allow time for its leaders to present a unified proposal. He added… pic.twitter.com/bu8MafOFwM
That type of development tends to affect risk sentiment across markets. Crypto has reacted to similar situations in the past, where uncertainty pushes investors to either reduce exposure or seek alternative stores of value.
Historical patterns during geopolitical tensions show mixed outcomes. Bitcoin sometimes behaves like a risk asset, especially during sudden shocks. At other times, it attracts capital as a hedge when traditional systems appear unstable. The current reaction leans toward cautious optimism, as BTC continues to hold near recent highs instead of breaking down.
KelpDAO Hackers Move $33M Into Bitcoin Through THORChain
A separate development introduces a different kind of risk. Data highlighted by Wu Blockchain reveals that attackers linked to the KelpDAO exploit have moved funds into Bitcoin.
An analyst known as Specter tracked these movements and found that roughly 442 BTC, valued at about $33 million, were distributed across more than 400 addresses. The transfers passed through THORChain, which saw its daily volume jump to around $211 million. That figure stands close to 10 times its recent average.
Some of these funds appear to overlap with wallets tied to earlier North Korea-related attacks. That connection raises concerns about how illicit capital flows through decentralized systems.
Large-scale laundering activity does not always move price immediately. Still, it can create underlying pressure, especially if those funds eventually return to exchanges. Market participants usually monitor such flows closely because they can introduce unexpected volatility.
Bitcoin Price Analysis Shows Momentum Building Near $78K Resistance
Bitcoin price now trades around $77,980 after gaining close to 6% over the past three days. That move brings BTC back to a level it has struggled to hold since early February.
A look at the BTC chart shows immediate support near $77,100 if a pullback occurs. The Relative Strength Index sits at 64, which leaves room for further upside before the market enters overbought conditions.
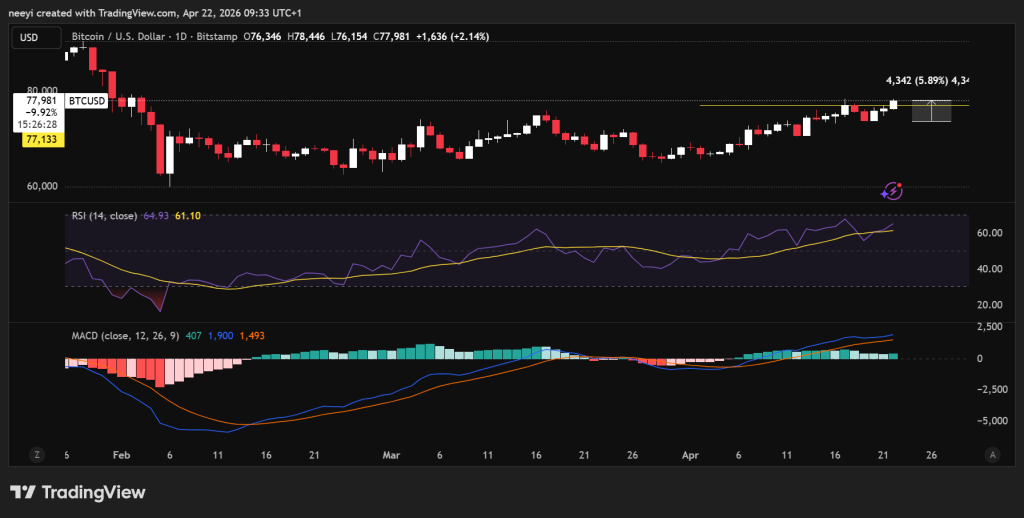
Momentum indicators also support the current trend. The MACD line remains above the signal line, and the histogram shows increasing buying pressure. Those signals point to a continuation attempt toward the $80,000 zone, which stands as the next psychological barrier.
Failure to hold above $77,100 could change the short-term outlook. A drop below that level may open the door for a move toward $76,300, where buyers may attempt to defend the price again.
Read Also: China Is Stockpiling Silver and Gold Like Never Before – Here’s the Data
Bitcoin now faces a moment where strong ETF inflows meet geopolitical uncertainty and unusual on-chain activity. That combination keeps the market balanced between optimism and caution.
FAQs
Subscribe to our YouTube channel for daily crypto updates, market insights, and expert analysis.


