Shiba Inu price has not delivered the kind of explosive upside moves that once defined its reputation. However, a setup shared a few hours ago points to a familiar speculative pattern that may be forming again.
The idea comes from a chart posted by data analyst and financial chartist Celal Kucuker, who mapped out a long term structure that could open the door to a 10x SHIB price move if key resistance levels finally give way.
The bigger message, however, is that the bullish structure still needs confirmation, and the daily chart shows that SHIB may need more time before any major breakout attempt becomes real.
A look at the weekly SHIB chart shows price trading inside a broad descending channel for a long stretch. The structure appears to run from the major highs into a prolonged compression phase, with the price repeatedly respecting both the upper and lower boundaries of the channel. Long-term channels often act as roadmap patterns. Price tends to remain trapped until buyers or sellers force a clean break.
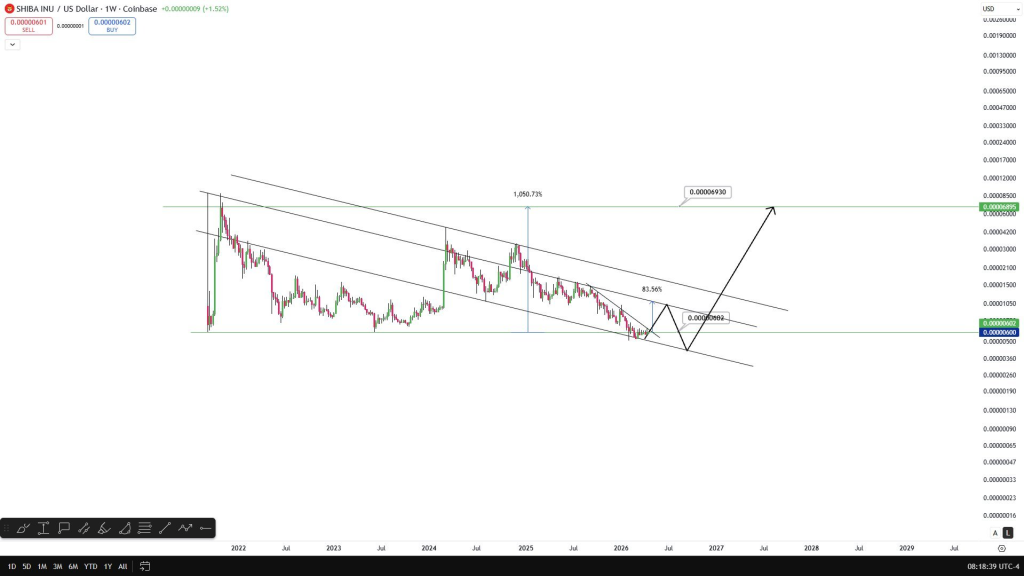
Kucuker’s chart suggests that SHIB is now sitting close to the lower portion of that channel. That area has acted as a support zone, and the projected path on the chart shows an initial bounce, a brief pullback, and then a stronger move toward the upper boundary.
From there, the more ambitious scenario points to a breakout above the descending structure, which could send SHIB toward about $0.0000693.
That projected target is important because it implies a gain of more than 1,000% from the current zone. The chart labels this upside path as a potential 1,050.73% move. That is where the 10x discussion comes from.
The setup is based on the idea that SHIB has spent a long period compressing inside a falling structure and could produce an outsized reaction if that structure finally breaks.
What you'll learn 👉
The Daily SHIB Chart Shows the Weekly Bullish Idea May Still Need More Time
The long term setup looks interesting on the weekly timeframe, yet the daily chart adds a note of caution. Recent price action does not show aggressive expansion yet. The market still looks range bound, which means the larger breakout idea may remain incomplete until SHIB proves it can escape its nearer resistance zones.
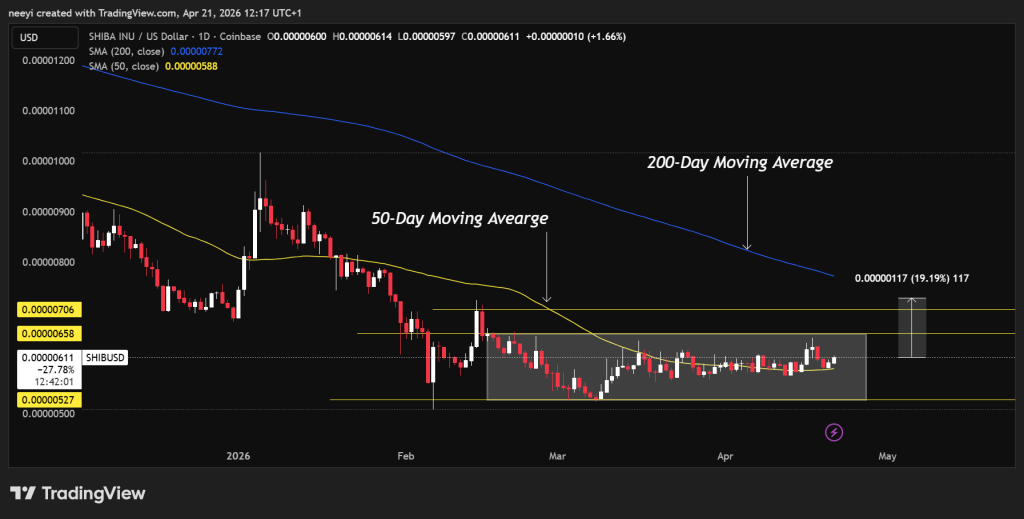
The consolidation, which started in february has kept SHIB moving between about $0.0000064 and $0.0000053. That range can be viewed as a possible accumulation area, especially after a long decline, but accumulation alone does not guarantee an immediate breakout. Price still needs to show clear strength.
The first step would be a break above this consolidation band. After that, SHIB would need enough follow-through to push above the next resistance around $0.0000070. That level matters because it could act as the first real sign that buyers are gaining control beyond short term noise.
A clean move above that area would not confirm the full 10x scenario on its own, though it would start to give the weekly chart more credibility.
SHIB Moving Averages Show Early Support But No Clear Explosion Yet
We also looked at the long-term and medium-term moving average structure. The 200-day moving average, marked by the blue line, remains above the price. That keeps it in view as a mid-term resistance barrier. As long as SHIB trades below that line, upside expectations need to stay measured.
The 50-day moving average, shown in yellow, offers a more constructive signal. It is now below the price and appears to be acting as immediate support. That positioning can help stabilize short-term pullbacks and support small upward moves across the next few sessions.
Read Also: XRP to Trade Below $1 in 5 Years? Top Analyst Reacts to Bold New Prediction
That said, support from the 50-day average is not the same as breakout strength. SHIB is still trading in a narrow range, and the price has not shown the force needed for a powerful escape. The weekly chart from Celal Kucuker presents a bullish long-term possibility, yet the daily structure says patience is still needed.
The larger setup keeps the 10x discussion alive, but the shorter-term chart still shows a market waiting for proof. The next move above consolidation may reveal whether this old speculative pattern is truly coming back or still needs more time to develop.
FAQs
Subscribe to our YouTube channel for daily crypto updates, market insights, and expert analysis.