
AAVE crashed over 18% today, falling from above $110 to around $91.80 at press time. The trigger is a KelpDAO exploit that created bad debt on the Aave protocol. Whales are dumping their AAVE holdings in response.
Three large transactions have been confirmed. Smaugvision sold 20,015 AAVE for 2.06 million USDC at an average price of $103. Whale 0xFC56 sold 20,000 AAVE for 2.05 million USDC, also at $103. Whale 0xA2E4 sold 19,666 AAVE (worth $1.95 million) for 505.65 ETH ($1.18 million) and 10.11 WBTC ($765,000) at an average price of $99.
What you'll learn 👉
The KelpDAO Exploit and Whale Dumping – Why the Market Is Panicking
The KelpDAO exploit created bad debt on Aave, meaning the protocol is left holding liabilities that may not be fully recoverable. Aave is a lending protocol, and bad debt undermines confidence in the platform’s ability to manage risk. When whales see a major exploit affecting a core DeFi protocol, they move first and ask questions later.
Due to the KelpDAO exploit creating bad debt on #Aave, $AAVE has dropped over 18% today. 🚨
— Lookonchain (@lookonchain) April 19, 2026
Whales are dumping $AAVE.
• smaugvision sold 20,015 $AAVE for 2.06M $USDC at $103 avg.
• Whale 0xFC56 sold 20,000 $AAVE for 2.05M $USDC at $103 avg.
• Whale 0xA2E4 sold 19,666 $AAVE… pic.twitter.com/NUjWxIgdp0
The three whale sales totaled nearly 60,000 AAVE, worth over $6 million. Selling pressure at $100‑$103 pushed price down to $99, then $91. The fact that multiple large holders exited at nearly identical price levels suggests coordinated concern, not random profit‑taking. Aave has not yet released a full post‑mortem or recovery plan, which adds to the uncertainty.
AAVE Price Outlook and Chart Analysis – Strong Downtrend Accelerating
Based on CoinAnk market data, AAVEUSDT currently trades at 91.840 USDT, down 20.153% in 24 hours. The 2‑hour chart shows a strong, accelerating downtrend. Key support levels sit at S1=85.660 and S2=78.940 USDT. Resistance levels are R1=105.490 and R2=118.600 USDT.
Moving averages are clearly bearish. Price at 91.84 trades significantly below all major MAs: MA5 at 96.19, MA10 at 102.81, MA20 at 108.90, and MA120 at 100.10. That long‑term bearish structure confirms the downtrend is real.
MACD shows deep bearish momentum. DIF at -4.299 is well below DEA at -1.797. The histogram at -2.502 is expanding negatively, indicating increasing downward momentum on the 2‑hour timeframe.
Bollinger Bands show AAVE price has broken below the lower band at 92.615 and now trades at 91.84, with %B at -0.01%. That signals an oversold extension but also extreme bearish pressure. A move back inside the band is needed for any stabilization signal.
RSI is deeply oversold across all periods: RSI6 at 13.56 and RSI14 at 24.11. While this suggests a potential for a short‑term bounce or consolidation, extreme downtrend momentum means RSI can remain oversold for extended periods. The signal is weaker than the trend‑following indicators.
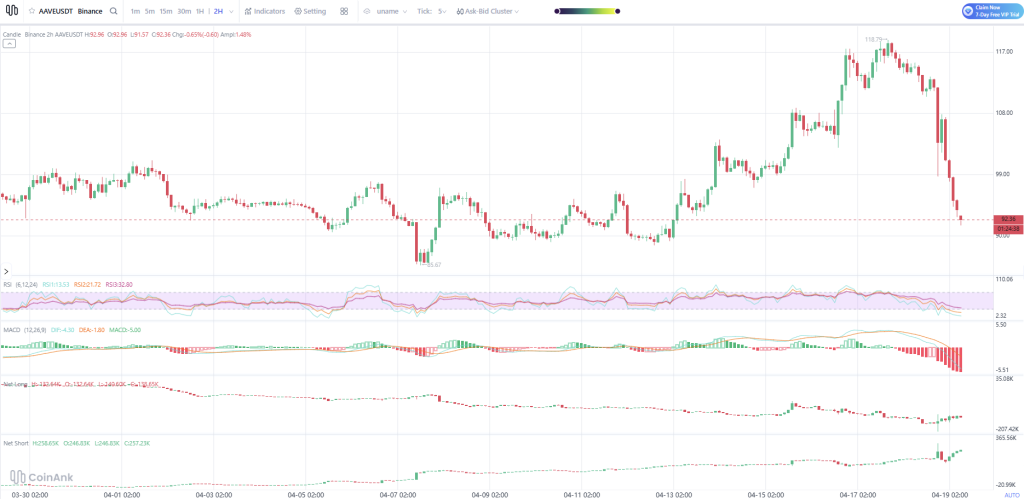
KDJ is also extremely oversold, with K at 7.88, D at 14.64, and J at 0.00. This aligns with RSI but shares the same limitation: it can stay low in strong trends.
Funding rate sits at 0.01000000%, a very low positive rate. This indicates neutral‑to‑slightly‑positive perpetual swap sentiment. It does not show extreme long liquidation pressure typical of capitulation, nor strong bullish conviction.
Volume and price action reveal the breakdown. The 2‑hour candle at the start of the crash (open 111.78, close 103.67, low 98.76) was a massive bearish engulfing candle with enormous volume of 1,285,187.4. Subsequent candles have failed to recover significantly, with price consolidating near lows on relatively lower but steady volume. Selling pressure persists.
Read also: How High Can Ripple’s XRP Price Go This Week?
Capital flow data is overwhelmingly negative. Contract net flow is negative across all timeframes: 5m at -1.02M, 1H at -2.04M, 4H at -5.58M, 24H at -18.70M. That indicates massive capital fleeing the futures market, driven by long liquidations and new short positions. Spot net flow is also predominantly negative (24H at -4.45M, 7D at -10.54M), showing net selling pressure in the spot market.
Trading strategy recommendation: Direction is short (aggressive) or wait for a retracement to enter. The trend is powerfully down. Ideal entry is on a failed retest of broken support turned resistance, watching for a pullback toward the 92.60‑95.00 zone. If price shows rejection there with increasing selling volume, that is a high‑probability short entry. A break below the recent low of 91.57 could also be used for a momentum short entry.
Stop loss for an entry near 93.00 should be set at 96.50‑97.00 (above MA5 and the consolidation high), representing a 3.8‑4.3% risk. Primary target is the S1 support at 85.66 USDT. A break below that opens the path to S2 at 78.94. From an entry near 93.00, the move to 85.66 offers roughly 7.9% potential return.
Frequently Asked Questions
Subscribe to our YouTube channel for daily crypto updates, market insights, and expert analysis.