The RAVE price is up nearly 36.64% in the last 24-hours, trading at $15.10 while the broader market stays flat. That kind of move stands out. But here is the context. The RAVE price crashed 30% from its all-time high of $19.85 on April 15.
What we are seeing now is a relief rally from deeply oversold conditions, amplified by negative funding rates that forced short sellers to cover their positions. The RAVE price is bouncing, but this is a volatility driven rebound, not necessarily a reversal of the downtrend.
What you'll learn 👉
The Bounce Is Real, But the Momentum Is Slowing
We had a look at the 4-hour chart, and the picture is extreme. The RAVE price is trading at $15.10 after a massive crash from $19.85. The 100 period SMA sits at $3.25, which means the RAVE price is still miles above its longer term average.
That is how violent the recent move has been. The chart shows a clear resistance zone near $15.22, which is where the RAVE price is currently knocking. Support sits at $12.36, then down to the $7.20 to $11 supply zone.
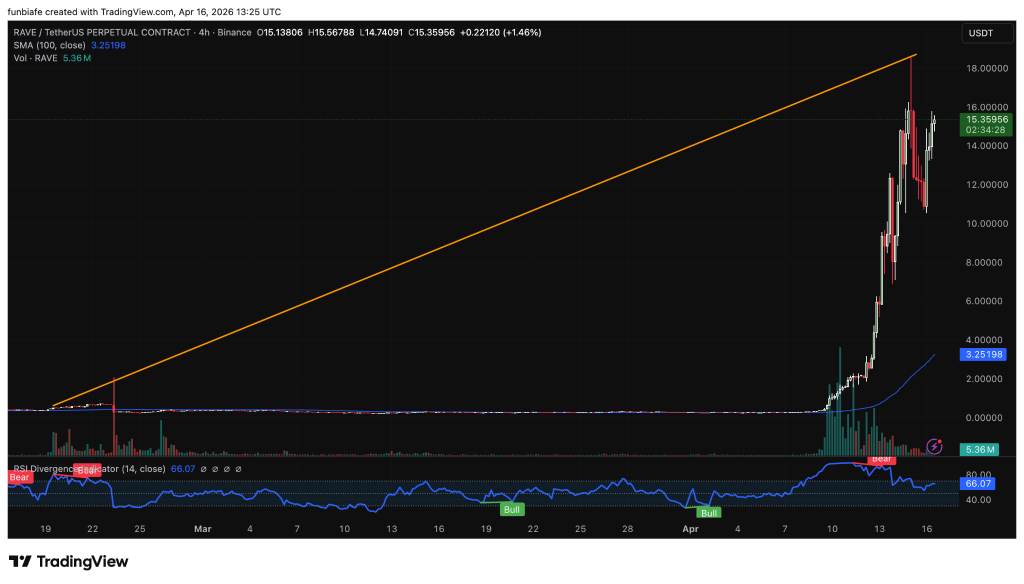
The RSI divergence barometer on the chart is at 66.07, which is bullish but getting close to overbought. The indicator also shows a bearish divergence setup. Price made a higher high recently, but momentum did not confirm. That is often a warning that the bounce could be running out of steam.
The volume on the chart is 5.36 million, which is decent but not explosive. The RAVE price is moving on technical factors and derivatives positioning, not new fundamental catalysts.
Read Also: RaveDAO’s Warning: RAVE’s $15B FDV Is a House of Cards – Insiders Hold 4.5x the Circulating Supply
Why the RAVE Price Is Moving
The primary driver of this move is a technical rebound and short squeeze. The RAVE price plunged 30% in one day. That extreme volatility often leads to a sharp counter trend bounce. On top of that, funding rates had been negative since April 10.
When funding rates are negative, short sellers pay longs. But when price starts rising, those short sellers get squeezed and have to buy back their positions. That adds fuel to the fire. The RAVE price bounce was amplified by that dynamic.
A modest rotation into altcoins also helped. The CMC Altcoin Season Index rose 8.57% in 24-hours. That is a small shift, but it provided a supportive backdrop. The RAVE price move was disproportionately large compared to the rest of the market, but it did not happen in a vacuum.
Where the RAVE Price Goes From Here
The immediate level to watch is $12.36. If the RAVE price holds above that support, a retest of the $15.22 resistance is likely. That is the first test. A break above $15.22 would open the door to the all-time high near $19.85.
But if the RAVE price breaks below $12.36, the next stop is the supply zone between $7.20 and $11. That would be a drop of 20% to 50% from current levels.
The RAVE price is bouncing hard, but this is still a high volatility retracement within a larger corrective pattern. The RSI divergence is a warning. The bearish divergence setup says momentum is slowing.
RAVE needs to consolidate above $12.36 to have any chance of continuing higher. If it gets rejected at $15.22 again, the downtrend likely resumes toward the $7.20 to $11 zone. The pump is real. The question is whether it can hold.
Subscribe to our YouTube channel for daily crypto updates, market insights, and expert analysis.