
The LINK price has been stuck in a boring range since February. Sideways between $8.20 and $9.55 for months now. Most traders have looked away. But that is exactly when things get interesting.
BSCNews just pointed out that Bollinger Bands have compressed on the 3 day chart, a classic setup before a sharp move. Heavy derivatives leverage is stacked at $8 support and $10 resistance. Something has to give. The question is which way.
What you'll learn 👉
What the 4 Hour Chart Shows Right Now
We had a look at the LINK chart, and the picture is tight. The LINK price is trading at $8.72, down 0.80% on the session, with a high of $8.83 and a low of $8.68. The 100 period SMA sits exactly at $8.78, right above current price.
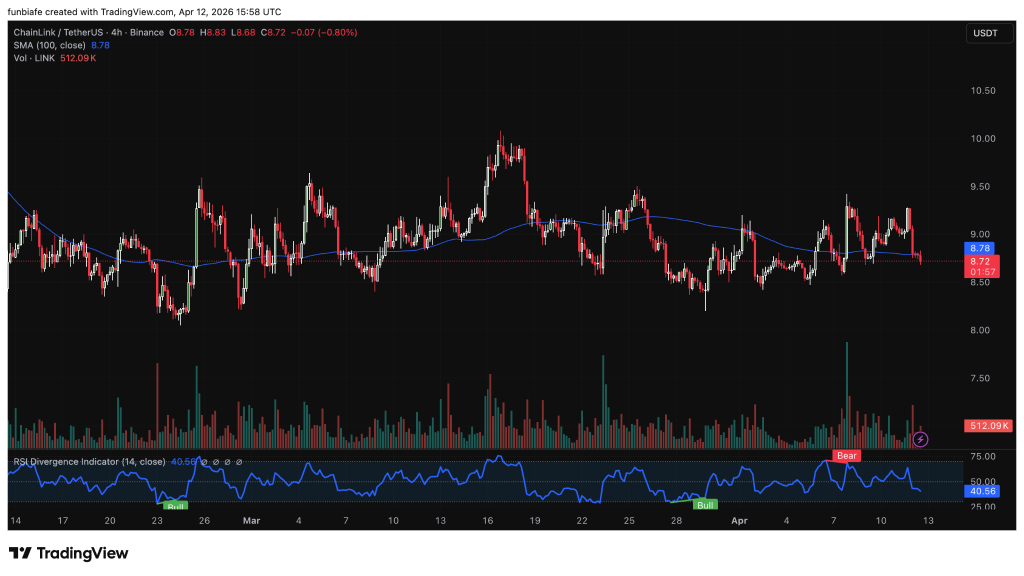
The RSI on the 4 hour chart is at 40.56, neutral to slightly bearish but not oversold. The indicator shows a bearish structure in the short term, but the longer term picture is different. The LINK price has been respecting the $8.20 support zone for months.
Each test of that level has been met with buying. The resistance at $9.55 has also held. The Bollinger Bands compression on the 3 day chart is the real signal. When bands tighten like this after months of sideways action, the breakout is usually violent.
The Two Paths for LINK Price
A break above $10 changes everything. That level is packed with derivatives leverage. Shorts are positioned there. If the LINK price pushes through $10, those shorts get squeezed, and the move could accelerate fast.
The target range on a breakout is $12 to $14. That is a 40% to 60% move from current levels. The 4 hour chart does not show those levels, but the 3 day structure puts them in play.
The downside path is just as clear. If the LINK price fails at support, the risk is a cascade toward $6. That would be a 30% drop from here. The key level to watch is $8.20. That support has held multiple times. If it breaks on volume, the bullish consolidation ends badly.
CHAINLINK APPROACHING A POTENTIAL BREAKOUT AFTER MONTHS OF CONSOLIDATION$LINK has been grinding sideways between $8.20 and $9.55 since February, but the technical tension is building. Bollinger Bands have compressed significantly on the 3-day chart, a classic precursor to a… pic.twitter.com/5NuIFBZcir
— BSCN (@BSCNews) April 12, 2026
The Fundamentals Stacking in the Background
The technical setup is one thing, but the fundamentals are quietly impressive. JPMorgan and UBS are running live settlement pilots on Chainlink infrastructure. That is not testnet stuff. That is real money from real banks.
Chainlink’s CCIP is processing $18 billion in monthly cross chain volume. Eighteen billion. That is not a small number. And the Bitwise LINK ETF just opened LINK to 401(k) accounts for the first time. Retail retirement money can now flow into Chainlink.
Whale accumulation is also happening. Wallets holding over 1 million LINK tokens are up 25% year over year. 125 such wallets now exist. That is a lot of supply being taken off the market. The LINK price is sitting in a consolidation zone while big players stack tokens and banks pilot the technology. The breakout, when it comes, has real fuel behind it.
Read Also: Where Could Cardano (ADA) Price Go This Week?
Where the LINK Price Goes From Here
The next few days are simple. Watch $8.20 support and $10 resistance. A break above $10 targets $12 to $14. A break below $8.20 targets $6. The LINK price has been coiling for months. The bands are tight. The leverage is stacked. The fundamentals are bullish. Now the market just has to pick a direction.
Subscribe to our YouTube channel for daily crypto updates, market insights, and expert analysis.