The TAO price just flashed a TD Sequential buy signal on the chart, and if history is any guide, something is about to move. Prominent analyst Ali Martinez pointed out that the last two times this exact signal appeared, the TAO price jumped 9% and then 19%.
That is a clean track record. Now the signal is back. The question is not whether the TAO price reacts. The question is how big this next move ends up being.
What you'll learn 👉
What the TAO 4 Hour Chart Actually Shows
We had a look at the TAO 4 hour chart shared by Ali, and the TD Sequential setup is a textbook. The indicator counts nine bars in a specific sequence, then flips to a buy or sell signal when the pattern completes.
The chart shows the count running from 1 through 9, and right at the 9, the TAO price printed a green candle. That is the buy signal. The previous two signals are also marked on the chart. One led to a 9% move. The next led to a 19% move. Both followed the same formation.
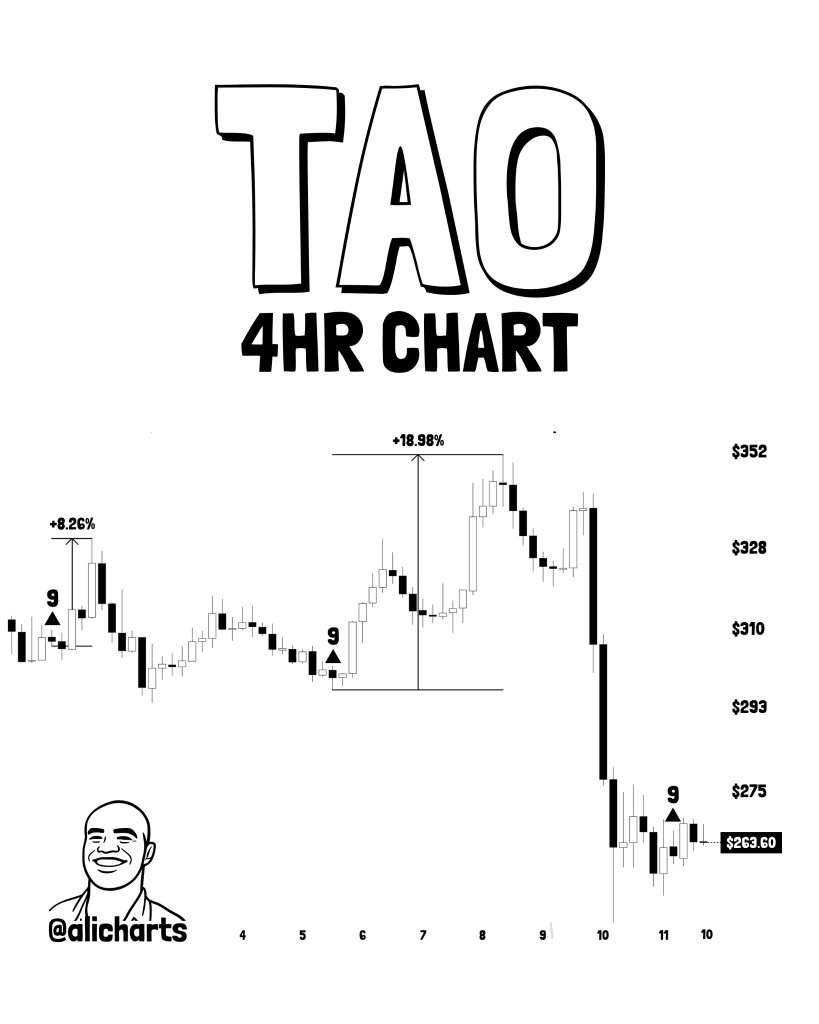
The current TAO price is trading near $263.60 on that chart, up almost 19% in the recent session. That move actually matches the larger of the two previous signals. The chart shows price levels stacking up from $275 to $293 to $310 to $328 to $352.
Those are the logical upside targets if the signal plays out again. The 9% target would put the TAO price near $287. The 19% target would put it near $313. The chart already has those levels marked.
Read Also: Bittensor (TAO) Slides 25% in 3 Days: Time to Buy Again or Stay Off?
Why the TD Sequential Works on TAO
The TD Sequential is not magic. It is a momentum exhaustion and reversal indicator. It works best in trending markets where price gets overextended and needs to be corrected.
On the TAO 4 hour chart, the indicator has a clean history because the token tends to move in sharp bursts followed by quiet consolidation. The buy signals appear at the end of those quiet periods. The 9% and 19% moves happened because the signal caught the exact turning point.
Ali Charts asked a simple question: what do you think happens now? The chart gives a simple answer. The same setup that delivered 9% and 19% moves is back. The TAO price has already started moving.
Where the TAO Price Goes From Here
The immediate level to watch is $275. That is the first resistance zone above current price. If the TAO price breaks that, the path to $293 and $310 opens up. The 19% target from the signal lands right near $313, which is just above that $310 level. A break above $328 would put the TAO price into fresh high territory, and the chart shows levels all the way up to $352.
There is always a chance this signal fails. If the TAO price rolls over, support sits at $245, then $230, then $215, a 20% drop from here. But the last two signals delivered 9% and 19% moves. Now the same pattern just printed again. Upside targets are $275 to $352. Downside floor is $215.
Subscribe to our YouTube channel for daily crypto updates, market insights, and expert analysis.