The gold price recovered alongside crypto prices following positive news around tensions in the Middle East. This means gold is now trading above $4,800 per ounce for the first time since mid-March. Gareth Soloway, a trader with over 259,000 YouTube subscribers, has laid out a bold roadmap for gold. Near-term bearish. Long-term bullish. Very bullish.
In his latest analysis, Soloway walks through the daily gold chart, the monthly logarithmic chart, and a series of parallel trend lines that correctly predicted gold’s recent top. Those same lines now point to a pullback to $3,500, followed by a historic rally to $10,000 by 2029 or 2030.
What you'll learn 👉
The Short-Term Picture: Why Gold Is Headed Lower First
Soloway starts with the daily gold chart. Before the recent sell-off, gold printed seven straight green candles. Then came a doji; a candle where price opens and closes near the same level, with a long upper wick and a long lower wick.
“A doji forms when you have momentum to the upside, momentum to the downside, and price ends right in the middle,” Soloway explains. After seven days of bulls in full control, sellers finally showed up. The battle ended in a stalemate. That change in character signaled a shift.
After that doji, gold fell hard to the $4,400 area. Then came a bear flag; a lower high, then a lower low. The chart shows lower lows and lower highs. That structure keeps Soloway bearish in the near term.
He expects gold could bounce to $4,800 or even $5,000. But the larger move points down. His mid-term target sits at $3,500.
“This is where I start buying pretty aggressively,” Soloway says. “I’ll swing trade gold all up in this range. But on the longer term, this is where I want to buy.”
Why Gold Needs to Wash Out Weak Hands
Gold has been acting like a risk asset. That is not normal. For hundreds of years, gold served as a risk-off safe haven. When speculative money piles in and gold starts trading like tech stocks, that excess has to be washed out.
“The degradation of fiat currencies, the U.S. dollar; every lesson that got people excited about gold over the last couple years, that’s a true factor. I believe in that thesis,” Soloway says. “You just got to wipe out the weak hands first. Get them to say, ‘Uh-oh, this wasn’t as easy as I thought,’ and they get out. Then gold returns to that anti-fiat protection asset.”
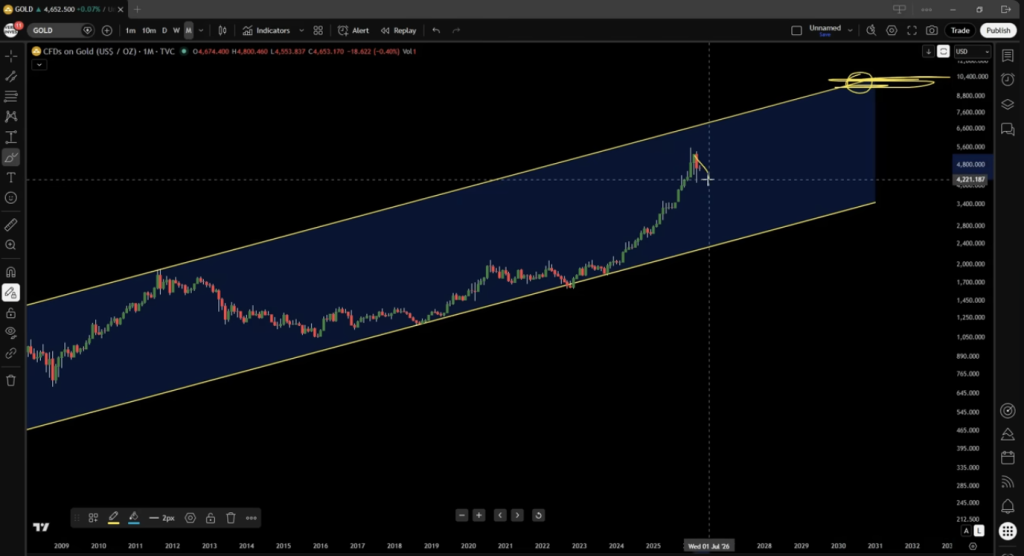
The Logarithmic Chart: Unlocking the $10,000 Target
Soloway flips to the monthly logarithmic chart going back to 1979-1980. He uses logarithmic scaling for long-term analysis (45 years of data) to show hidden patterns.
The Parallel That Called the Top
He draws a trend line from a low pivot to another low pivot, then creates a parallel line up to the 1980 high. That parallel line hit perfectly near gold’s recent peak around $5,600.
“This is amazing,” Soloway says. “When I was getting bearish on gold because it was going parabolic and so many people were bullish, the chart was saying, ‘No, it’s not that easy.'”
He notes the same technique worked on the S&P 500 to predict the recent down move. It also worked on Bitcoin; the parallel from the 2017 high to the 2021 high correctly signaled Bitcoin’s top in 2025 when everyone else was bullish.
Read also: Bitcoin vs Gold and Silver: Why One Analyst Calls BTC a “Generational Wealth Machine”
The Second Parallel: Support at $3,500
Soloway draws another trend line. This one connects the low from 2001 through the lows of 2018, 2022, and 2023. On the logarithmic chart, those lows align perfectly.
Then he extends a parallel line upward. That line served as support, support, support, then resistance, resistance, resistance, and then a breakout.
Now look at where that same trend line sits if the gold price retraces. Right near $3,500.
“That means not only is that major technical support, but it also has a secondary factor there,” Soloway says.
The $10,000 Projection
Using the same logarithmic parallel method, Soloway projects the next bull cycle. The previous high from 2011 serves as a reference point. If the next bull run concludes in 2029 or 2030 (roughly three years from now) where does the parallel line point?
$10,000.
“Right up here in 2030. 10,000 right there,” he says, pointing to the chart. “Pretty incredible stuff, isn’t it?”
Summary: Soloway’s Gold Roadmap
| Time Frame | Direction | Target |
|---|---|---|
| Short-term (weeks to months) | Bearish | $3,500 |
| Mid-term (after $3,500) | Bullish accumulation | Buy zone |
| Long-term (2029-2030) | Bullish | $10,000 |
Soloway acknowledges the near-term downside. He expects gold to continue lower, possibly bouncing to $4,800-$5,000 first, then dropping to $3,500. That $3,500 level represents major technical support; the same logarithmic trend line that has held for decades.
Once weak hands exit, gold returns to its true role as a hedge against fiat currency degradation. And the logarithmic chart shows the path ahead: $10,000.
Subscribe to our YouTube channel for daily crypto updates, market insights, and expert analysis.