Polkadot price continues to struggle near key resistance levels, and the recent rejection has started to align with a broader bearish structure on the chart. The current DOT price action shows weakness after failing to sustain momentum above recent highs, and that behavior now puts lower targets back into focus.
The structure forming here suggests that downside liquidity remains the next likely destination if current conditions persist.
A closer look at the DOT price structure shows a clear rejection after price moved into a higher timeframe premium zone. That zone aligns with a weekly breaker level, which often acts as strong resistance during bearish market conditions.
Crypto Patel explains that this type of reaction usually appears after buy side liquidity gets swept. Price moves above previous highs, triggers liquidity, and then reverses direction as selling pressure returns.
That rejection near the previous weekly high adds weight to the bearish outlook. The structure has not changed, and the broader trend still points lower unless a strong reversal appears.
Crypto Patel outlines clear downside targets based on the current setup. The first level sits near $1.210, followed by $1.170, and then a deeper move toward $1.101.
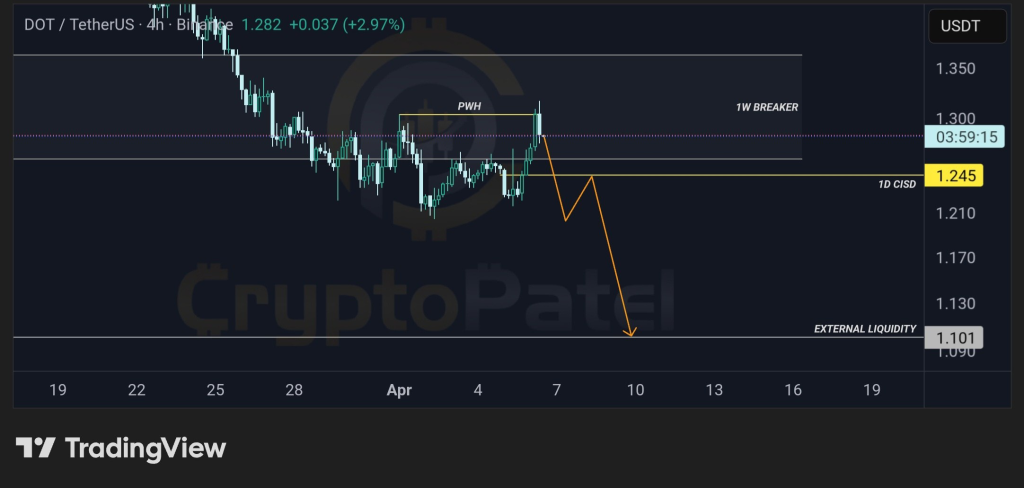
These levels align with visible liquidity zones on the chart. Price tends to move toward these areas once a bearish structure remains intact.
The invalidation level also remains important. A confirmed move above $1.320 would challenge the current bearish outlook and suggest that buyers are regaining control.
Until that happens, the downside targets remain active.
What you'll learn 👉
DOT Chart Shows Weak Recovery Attempts And Lower High Structure
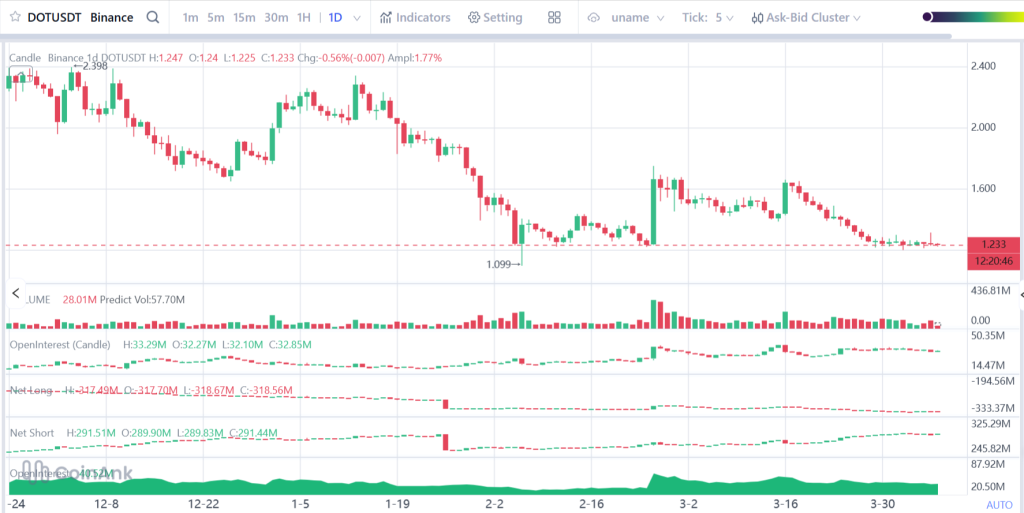
Looking at the chart you provided, the DOT price shows a consistent pattern of lower highs after the major drop from above $2.300. Each recovery attempt fails to break previous resistance, which confirms that sellers remain in control.
The price recently stabilized around $1.230, but the lack of strong upward continuation suggests limited buying interest at current levels. The small candles and tight range near support indicate hesitation rather than strength.
That reaction reveals something important. Buyers are not stepping in aggressively, and that usually allows sellers to push price toward the next liquidity zone.
Open Interest Trends Show Limited Conviction Behind Current Price
Open interest remains relatively stable after a period of decline, which suggests that fewer new positions are entering the market. This type of behavior often appears during consolidation phases before another move develops.
When open interest does not increase alongside price recovery, it shows that the move lacks strong participation. That condition makes upward continuation less reliable.
If open interest starts rising during a drop, it would confirm that new short positions are entering, which could accelerate the downside move.
Net Long And Net Short Data Reveal Bearish Positioning Bias
The net long positioning has stayed relatively flat to slightly declining, which suggests that long traders are not adding significant exposure. That lack of confidence often appears when the market expects further downside.
Net short positioning, on the other hand, has shown a gradual increase. That trend indicates that more traders are positioning for a continued drop in DOT price.
This imbalance between long and short positions creates downward pressure. When more participants expect lower prices, that expectation often feeds into actual price movement.
Market Setup Aligns With Bearish Continuation Scenario
Combining the chart structure, open interest, and positioning data gives a clear picture. The DOT price remains in a bearish trend, with weak recovery attempts and increasing short interest.
Crypto Patel’s bearish outlook aligns with what the chart is showing. The rejection from resistance, combined with the presence of liquidity below current price, supports the expectation of further downside.
Read Also: Why Chainlink (LINK) May Be Close to a Big Move in the Next Few Hours
The next move will likely depend on whether price breaks below the current consolidation zone. A clean move lower would open the path toward the identified targets, while a strong break above resistance would invalidate the bearish structure.
For now, the pressure remains on the downside, and the market appears to be preparing for another leg lower.
Subscribe to our YouTube channel for daily crypto updates, market insights, and expert analysis.