Bitcoin is trading near $70,000 right now, and most traders are watching the price. But Crypto Patel, a seasoned analyst on X, is looking at something else entirely; something that might matter more for anyone holding altcoins.
His latest chart isn’t about Bitcoin’s price. It’s about Bitcoin dominance. And if his read is correct, the setup forming on the monthly chart could be the precursor to the next major altcoin run.
What the Chart Shows: A Pattern That’s Repeated Twice Already
Patel posted a monthly chart of Bitcoin dominance (BTC.D) stretching back to 2017. The chart tracks Bitcoin’s share of the total crypto market cap, and it highlights a specific zone: the 58-64% resistance level.
In 2018, Bitcoin dominance climbed into this zone, got rejected, and then broke down. What followed? A mega altseason. Alts went parabolic as capital rotated out of Bitcoin and into the broader market.
In 2021, the same thing happened. Dominance pushed into the 58-64% zone, stalled, and then rolled over. Again, altcoins exploded higher.
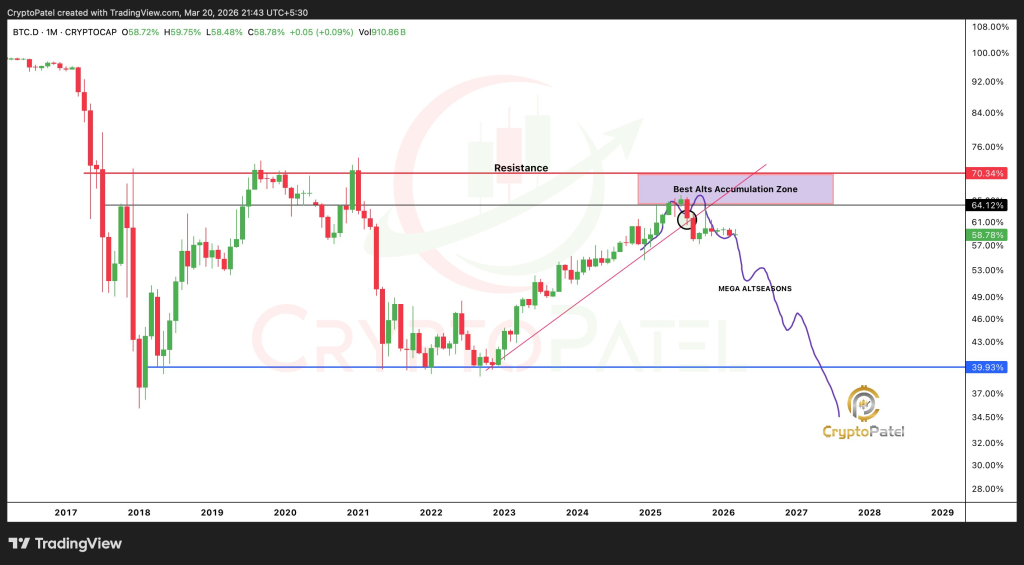
Now, in 2026, Patel points to the chart and says: “We’re here again.”
BTC.D is currently at 58.78%, right inside that rejection zone. The monthly chart shows dominance has been grinding higher since late 2024, but it’s now bumping into levels that have historically acted as ceilings.
Patel’s annotation on the chart marks this area as the “Resistance / Best Alt’s Accumulation Zone.” Below it, he labels the region between roughly 46% and 57% as the “MEGA ALTSEASON” zone; the territory dominance falls into after the rejection, when altcoins historically rally hardest.
Why This Matters for Altcoin Holders Right Now
The takeaway is simple but powerful. If history repeats, Bitcoin dominance is about to top out and start rolling over. That doesn’t mean Bitcoin crashes. It means capital stops flowing into BTC and starts rotating into altcoins.
Patel’s view is that the current moment (with dominance pressing against this multi‑cycle resistance) is the accumulation window for alts. Not when the breakout happens. Not when prices are already ripping. Right now.
His tweet sums it up: “When BTC.D Breaks Down From This Level… Alts Go Parabolic. Best Alts Accumulation Zone = IMO RIGHT NOW.”
For anyone holding altcoins, the frustration of the past months might be the prelude to a reversal. Patel’s chart indicates that patience, and accumulation at these levels, could be rewarded when dominance finally turns.
Subscribe to our YouTube channel for daily crypto updates, market insights, and expert analysis.