A shocking DeFi mistake drew attention across the crypto market after a trader attempted a massive swap through the Aave interface and ended up losing almost the entire value of the transaction.
The trader tried to convert $50 million in USDT into AAVE tokens using the official Aave application. The final outcome turned that $50 million trade into only $35,913 worth of AAVE.
Analyst Diana, on X, explained what happened in detail. The trade went through despite very clear warnings on the screen that the slippage settings were extremely high.
The trader confirmed the transaction on their phone anyway. Seconds later the system executed the swap and returned only 324 AAVE tokens, which meant roughly $49.4 million disappeared through slippage during the transaction.
🚨Trader Accidentally Swaps $50 MILLION to $35,913 in AAVE —LOSING $49.4 MILLION IN SLIPPAGE 🤯🔥
— Diana (@InvestWithD) March 12, 2026
A trader tried to swap $50 MILLION $USDT for AAVE tokens using the official @Aave app.
⚠️ Even though the screen showed CLEAR WARNINGS about HUGE SLIPPAGE risks, and they… https://t.co/kcvAlw0gG3 pic.twitter.com/Mnp3z55Nse
The scale of the loss immediately raised questions about how decentralized trading interfaces handle extreme slippage settings. Aave founder Stani Kulechov acknowledged the situation publicly and stated that the protocol would refund the roughly $600,000 in swap fees generated by the transaction. The core loss still came from the liquidity mechanics of the trade itself.
What you'll learn 👉
Massive Slippage In The Aave Trade Turned A $50 Million Swap Into Only 324 AAVE
Decentralized exchanges execute trades directly against liquidity pools. Price moves automatically when a large order enters a pool that does not contain enough liquidity to absorb the trade.
Diana explained that the trader allowed extremely high slippage tolerance. That setting gave the system permission to complete the transaction even if the execution price moved dramatically during the swap.
Large trades can push the pool price higher step by step. Every part of the swap buys AAVE at a worse price than the previous part. The effect becomes brutal when the order size dwarfs the available liquidity.
The trader therefore bought AAVE at rapidly rising prices during the execution process. The final result produced only 324 tokens for a transaction that started at $50 million.
Aave developers are now examining ways to reduce the chances of similar accidents. The challenge involves balancing safety protections with the open nature of decentralized finance systems where users control their own transactions.
AAVE Price Data Shows The Token Still Deep Below Its 2025 Peak
The unusual trading incident appeared at a time when the AAVE price already sits far below its previous market peak.
Current AAVE price data shows the token near $115. That level sits dramatically below the $385 peak recorded in August 2025. The market therefore, remains in a large drawdown phase even though the token attempted a recovery during the past month.
Short-term price action suggests stabilization instead of a new collapse. Monthly performance moved slightly positive, which indicates buyers have stepped back into the market after a long decline.
| Metric | Level | Interpretation |
|---|---|---|
| Last 2025 high (August 2025) | $385 | Major local peak in the last cycle |
| 24h change | +6.53% | Short term bounce attempt |
| 7d change | −1.42% | Still soft over the past week |
| 30d change | +7.11% | Modest recovery over the last month |
AAVE Price Trend Signals Show Long Term Weakness But Short Term Stabilization
Moving averages provide additional context for the current AAVE price structure.
The 7 day moving average sits near $109.33, which places the current price slightly above the short term trend. That position usually indicates early recovery conditions after a decline.
The 30 day moving average sits close to $116.16. AAVE trades almost exactly on this level. That position often marks a neutral phase where buyers and sellers compete for control of the next direction.
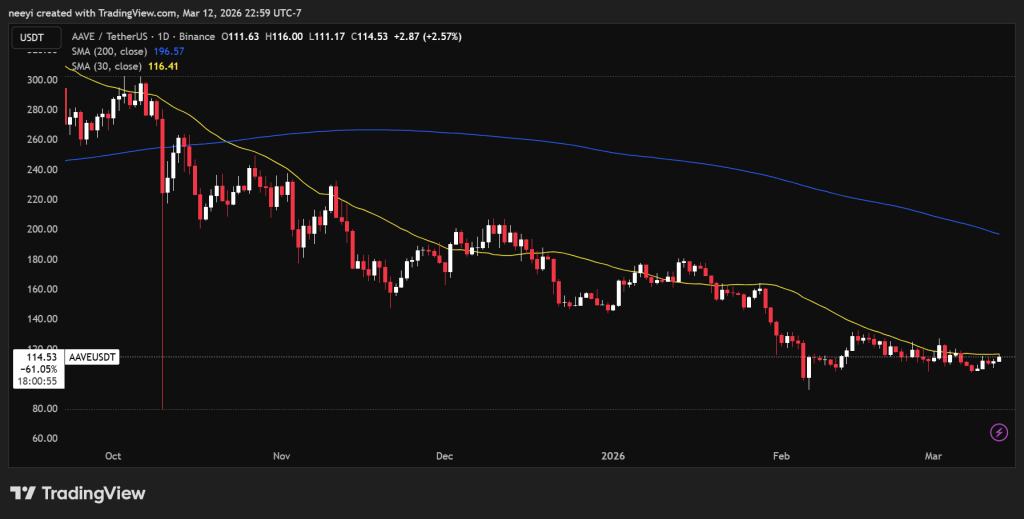
Long term structure still shows heavy pressure. The 200-day moving average stands near $197.59, which leaves the current price roughly 41.75% below the long term trend line.
Momentum indicators tell a similar story. The MACD remains negative overall. A small positive histogram shows the downward momentum has cooled slightly.
AAVE Price Faces A Critical Decision Zone Between $114 And $118
Recent price swings reveal the key levels that will likely decide the next AAVE move. The 30 day moving average sits near $116. The daily pivot level stands around $110.52. Price now trades between these important markers.
AAVE therefore sits inside a tight decision range between $114 and $118. Price stability above $114 would keep the short term recovery structure intact.
A push above $118 could open the path toward the next checkpoints near $125. The recent swing high near $130 to $132 in february becomes the next upside target if that move develops.
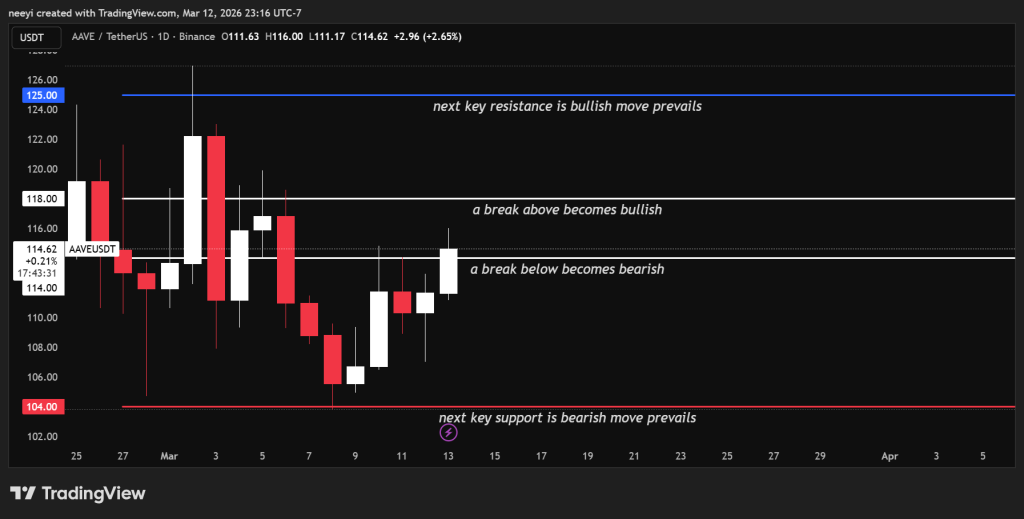
Breakdown risk still exists beneath the current level. Loss of $114 would weaken the rebound attempt. A fall through the $110 pivot zone would increase the probability of another test near $104. That scenario could eventually expose the psychological $100 support level.
Read Also: Analyst Stands Firm on Bittensor (TAO) $500 Target Despite Recent Pullback
The larger market picture still shows AAVE trading deep inside a broader downtrend since the 2025 peak. Short term indicators show stabilization around the current price range. The next weeks will reveal whether AAVE can transform this stabilization phase into a stronger recovery or if another downward leg appears first.
Subscribe to our YouTube channel for daily crypto updates, market insights, and expert analysis.