Kaspa (KAS) starts the new week with its price sitting near an important support level as several network updates continue to roll out. The network is preparing for a major covenant-focused hardfork expected in May, which aims to introduce native assets and smart contract functionality to Kaspa’s Layer-1 ecosystem.
However, the network passed a major milestone, surpassing 600 million processed transactions, highlighting the real-world throughput of its BlockDAG architecture.
Development activity has also continued to move forward. Rusty Kaspa v1.1.0 was released on March 4, which allows nodes to sync faster and provides a cleaner API to make integrations more accessible to developers.
These changes come as the KAS price is re-testing a major technical level with traders paying close attention to see if the level holds or if another move lower is required.
What you'll learn 👉
Kaspa Price Structure Shows Prolonged Downtrend
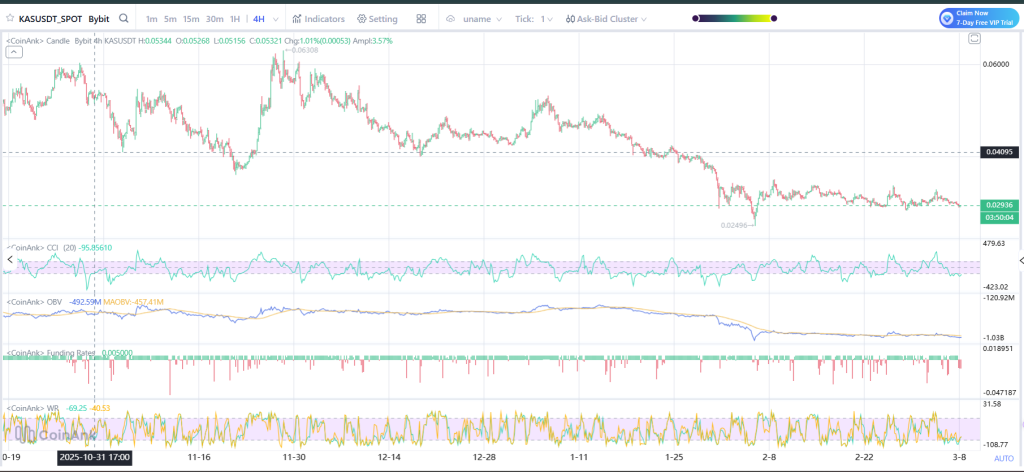
As the KAS chart demonstrates, the market has spent the past few months trending lower from a peak formed at the $0.063 price area late last year. Since then, the market has formed a series of lower highs, eventually pushing the price lower into the current downtrend.
Selling pressure accelerated late January, eventually driving the KAS price down to the $0.025 price area, which represents the lowest price point within the current downtrend. However, the market has seen some buying activity at this price level, driving the price of the KAS token slightly higher.
Over the past few weeks, the market has traded within a tight range between the $0.028 and $0.031 price areas. This type of price action often forms after a strong downtrend, as the market seems to be consolidating and determining the course of action to take from the current price level.
Indicators Show Weak Momentum but Signs of Stabilization
Several indicators on the chart help explain the current conditions. The CCI indicator is fluctuating around neutral territory, showing occasional bursts of momentum that fade quickly. This type of behavior often appears when the market lacks strong directional conviction.
On-Balance Volume (OBV) also maintains a slight downward slope. This indicates that strong accumulation levels have not yet returned. Traders’ activities remain cautious after the last selloff.
Still, the funding rates are mixed, and the Williams %R indicator often crosses through the oversold area. These observations indicate that traders’ activities remain cautious, yet the markets start to stabilize near support levels.
Read Also: Sui Price Prediction: Analyst Says SUI Could Rally 25x From Here
Kaspa Price Levels to Watch This Week
For now, the most important level on the chart sits near $0.028–$0.029, which has been acting as the key support zone during the recent consolidation.
If buyers manage to keep the KAS price above this area, the first upside objective appears near $0.033, followed by a stronger resistance region around $0.038–$0.041 where the previous breakdown occurred.
Such a move above $0.041 would represent the first major structural move and could potentially pave the way for a move to $0.048 during the subsequent sessions.
On the downside, a loss of the support at $0.028 could see the KAS price revisit the lows at $0.025. If this support fails to hold, the next support comes in at $0.022, which represented a demand area during the initial part of the trend.
For the time being, the price action of Kaspa remains within a tight range, with the market awaiting either the resumption of buying pressure or the continuation of selling pressure to dictate the subsequent course of action.
Subscribe to our YouTube channel for daily crypto updates, market insights, and expert analysis.