This chart is making a lot of altcoin holders pause, because it points to one thing: the market may still be in distribution, not accumulation.
Top account Our Crypto Talk, followed by over 77,000 traders, shared a warning that cuts straight through the usual “altseason soon” narrative.
Their point is simple. Sell pressure across altcoins has reached an extreme level, and the data does not look like a market preparing for a major breakout.
If positions are still held in names like $LINK, $KAS, $TAO, $RENDER, or $SUI from much higher prices, this chart is worth paying attention to.
What you'll learn 👉
The Altcoin Chart Shows 13 Months of One-Way Selling
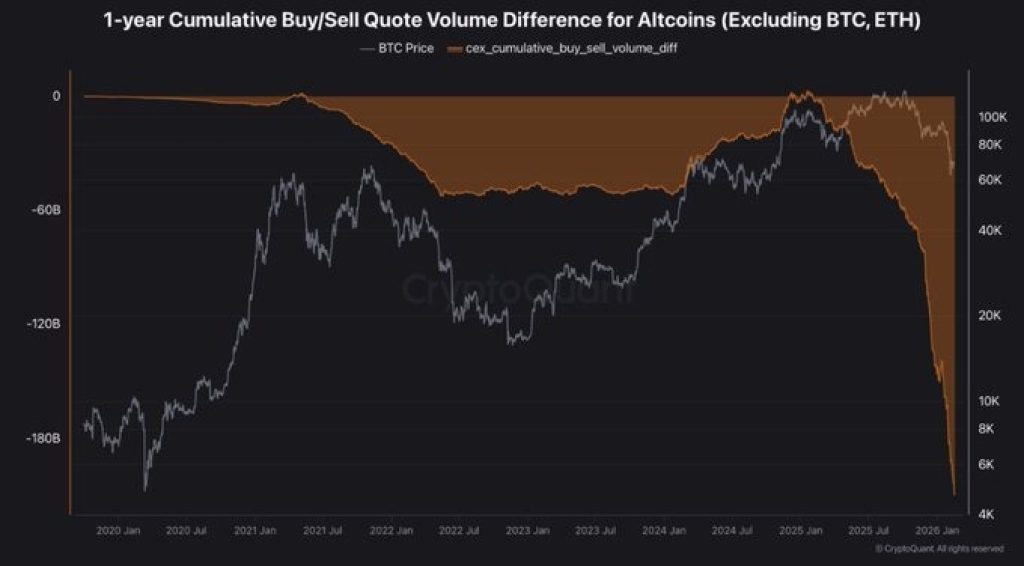
The chart tracks the one-year cumulative buy/sell quote volume difference for altcoins, excluding Bitcoin and Ethereum. The orange line represents net spot flows on centralized exchanges. And it is not pretty.
Instead of stabilizing or flattening out, the line has been falling for over a year. That means sellers have consistently overwhelmed buyers month after month. This is not a short-term dip or a brief wave of panic selling.
This has been a sustained period of distribution. Even during the 2022 bear market, there were moments when selling pressure eased and the market started building a base. Here, that relief has not really shown up. The pressure has simply continued for Altcoins.
Why This Doesn’t Look Like Accumulation Yet
In past cycles, major bottoms were often marked by absorption. Selling would slow down, buyers would step in, and the flow data would start leveling off. That is not what this chart shows.
Instead, the cumulative delta keeps sliding deeper into negative territory, hitting levels not seen in five years. The message is clear: spot demand has not returned in a meaningful way.
Small rallies keep getting sold, and breakouts struggle to hold. That is usually what happens when buyers are hesitant and liquidity stays thin.
Read Also: Big XRP and ADA Market Caps Just Found a Tax-Free Liquidity Shortcut on Base
Where Is the Big Money Rotation?
One of the biggest takeaways from this chart is what it implies about capital allocation.
If large players were quietly accumulating altcoins, the flow data would start to shift. The line would flatten. Net selling would cool off. Volume would begin to balance. But the chart shows none of that.
Instead, it looks like capital has been rotating away from alts for months. Some of it has moved into Bitcoin, some into stablecoins, and some may have left the market completely.
Retail activity is also lower, narratives feel weaker, and altcoin liquidity is not what it was during the peak cycle years. This is not the environment where random alt explosions happen without warning.
However, the most concerning part is not just the size of the sell pressure. It is the duration. Markets can recover from panic quickly. They struggle more when outflows become structural.
When distribution lasts this long, it reshapes the market. Order books thin out. Bounces get sold faster. Momentum fades quickly.
That is exactly what has played out across many altcoin charts over the past year. Every bounce feels heavy. Every rally runs into supply. Until spot flows start improving, the broader altcoin market remains in a tough position.
Altcoin Holders Need to Watch the Flows
The main message from Our Crypto Talk is not fear. It is data.
Altcoins are not showing clear signs of accumulation yet. The chart still points to prolonged distribution, and ignoring that can be costly.
For holders of coins like LINK, KAS, TAO, or ONDO, the next real signal will not come from hype. It will come from flow reversal, stabilization, and buyers finally stepping back in with size.
Until that happens, the altcoin market is still in a phase where caution matters more than hope.
Subscribe to our YouTube channel for daily crypto updates, market insights, and expert analysis.