
Solana price has entered a quiet phase that often appears after major market declines. Large rallies in previous cycles did not begin during excitement. They started when attention faded and structure slowly rebuilt.
A chart analysis shared by Crypto Patel highlights how the current SOL price movement may be echoing a historical pattern that once preceded dramatic expansion.
Crypto Patel points to Solana’s first major cycle between 2020 and 2021, where price moved from about $1.07 to nearly $260. That rise represented an extraordinary percentage expansion before a deep correction pulled SOL down close to $7.78.
A second cycle then unfolded between 2022 and 2025, carrying Solana price toward roughly $295 before another large decline began. Present conditions now show SOL trading far below its previous peak after a correction of more than 70%, which creates the foundation for the current fractal comparison.
Solana Price Structure Mirrors Earlier Correction And Accumulation Phases
The attached chart illustrates how each historical rally followed a similar rhythm. Strong upward expansion came first. A sharp retracement then reset the market before accumulation quietly formed near lower Fibonacci levels. Crypto Patel identifies the same type of retracement zone developing again, particularly around the 0.5 to 0.618 Fibonacci region that sits roughly between $30 and $50.
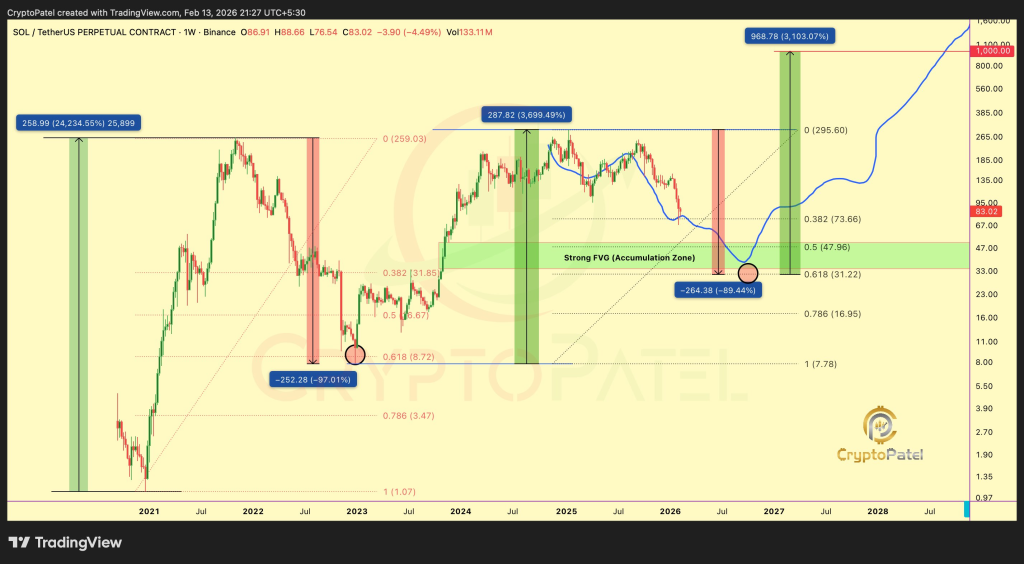
This area appears highlighted on the chart as a potential fair value or accumulation region where long term positioning could begin. Previous cycles showed that consolidation inside comparable zones often preceded renewed upward momentum.
Repetition of structure does not guarantee identical outcomes, yet recurring behavior across cycles provides meaningful context for evaluating risk and opportunity.
Price action also shows that volatility tends to compress before major directional movement returns. The current SOL price pattern reflects that compression phase. Market structure therefore becomes more important than short term fluctuations when assessing the broader trajectory.
Long Term SOL Price Path Depends On Support Stability And Historical Fractal Continuation
Crypto Patel outlines possible long horizon targets between $500 and $1,000 if the historical fractal continues to unfold. These projections align with the scale of earlier expansions that followed deep corrections. Movement toward such levels would require sustained support above the identified accumulation zone and gradual rebuilding of trend strength across higher timeframes.
The chart further suggests that deeper retracement remains possible before any confirmed recovery begins. Historical cycles often tested patience through extended consolidation prior to breakout. Stability inside key Fibonacci support therefore remains the central condition to watch.
Read Also: Gold and Silver Risk Multi-Year Decline as Russia Signals Return to Dollar System
Solana now sits at a technically sensitive moment shaped by repetition of past structure and the uncertainty that always surrounds new cycles. Crypto Patel presents the current formation as a reminder that major rallies often grow from quiet foundations rather than immediate excitement.
Subscribe to our YouTube channel for daily crypto updates, market insights, and expert analysis.