
Bitcoin’s latest drop has reignited a familiar debate across the market: was that the bottom, or is the real pain still ahead? With BTC now hovering around the $70,000 level, traders are desperately trying to figure out whether this was just another leverage flush… or the start of something much deeper.
Two analysts, Alex Mason and Brett, have both pushed the same uncomfortable idea this week: the most important signal in Bitcoin is the historical structure of how bottoms actually form.
And if history is any guide, the market may not be done yet.
What you'll learn 👉
Alex Mason’s Warning: Timing Matters More Than Price
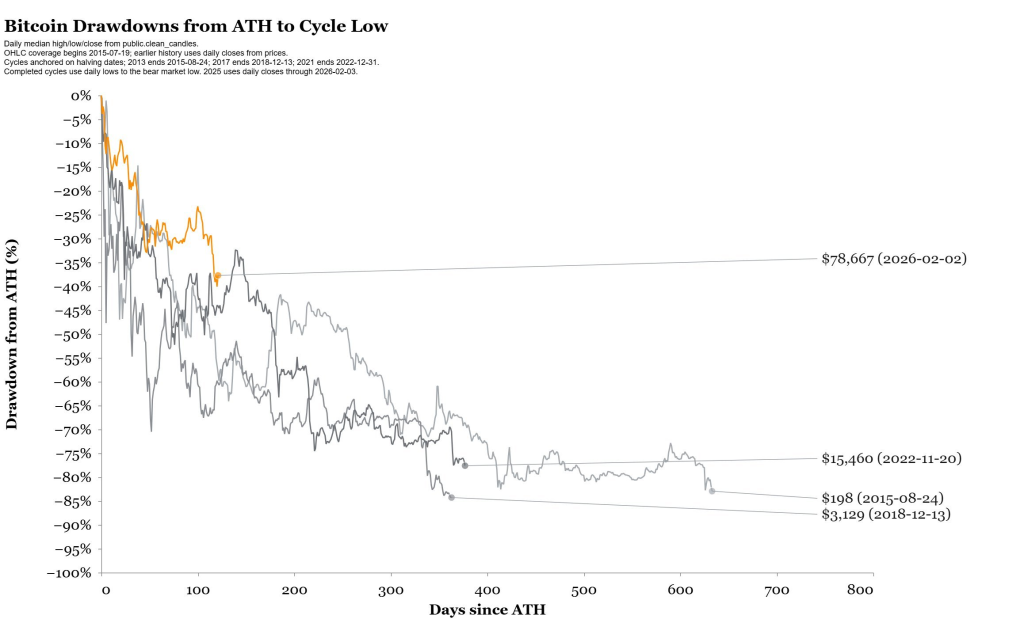
Alex Mason’s tweet focuses on something most traders completely ignore during corrections: cycle timing.
The chart he shared tracks Bitcoin drawdowns from all-time highs to eventual cycle lows, and the takeaway is simple. In previous bear markets, the true bottom didn’t arrive immediately after the first major sell-off. It took time (often hundreds of days) for Bitcoin to fully bleed out and reset sentiment.
That’s the part most traders struggle with.
Everyone wants a clean number: “I’ll buy at $60K” or “The bottom is $50K.” But Mason argues that the market doesn’t work like that. Historically, the final low tends to arrive after a long psychological grind, not during the first wave of panic.
The timing window is what makes his argument so unsettling. If Bitcoin is still early in that cycle timeline, then even a sharp bounce from $70K doesn’t necessarily confirm anything. It could simply be a pause before the next leg down.
In other words, price may already feel cheap… but time may not be finished doing its damage.
Brett’s Chart: The -50% Marker Is Only the Beginning
Brett’s tweet reinforces that same idea, but through an even more brutal historical lens.
His chart highlights something Bitcoin traders often forget: bear markets rarely end with a clean V-shaped recovery. Outside of extreme liquidity events like trillions in quantitative easing, Bitcoin typically does not bottom instantly.
Instead, it forms a base.
That base is usually messy, slow, and deeply frustrating. Months of sideways chop, repeated fakeouts, dead-cat bounces, and emotional exhaustion. That’s how Bitcoin resets.
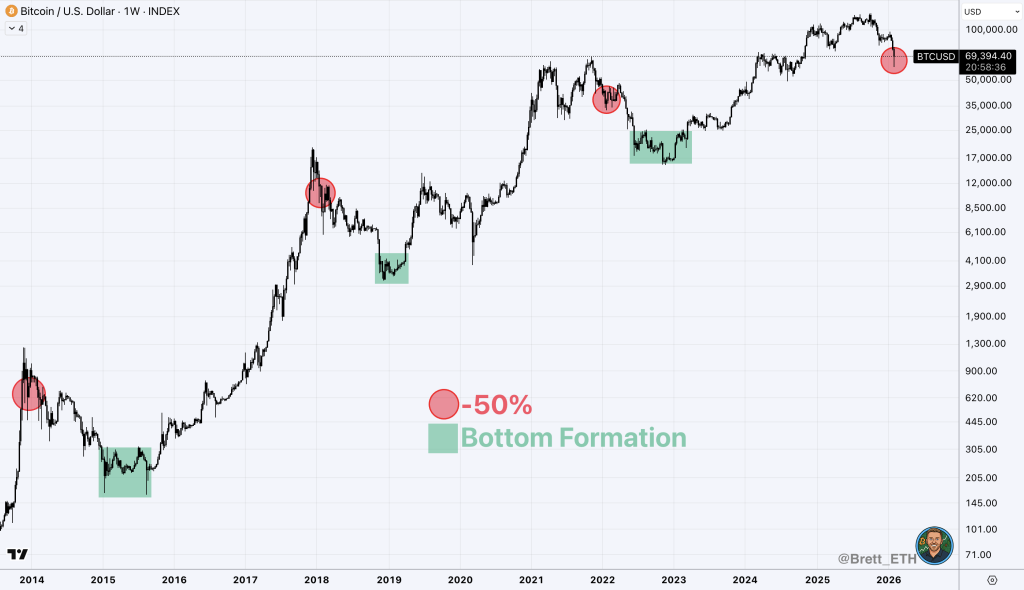
What makes Brett’s chart so important is the pattern it shows across multiple cycles: the -50% drawdown marker is not the finish line. It’s often just the entry point into the real bottom formation zone.
The red circles on his chart mark the initial major breakdowns, and the green zones highlight what happens next – extended consolidation periods where Bitcoin trades sideways for months before a true uptrend begins again.
That’s the signal traders are ignoring.
Not the wick. Not the bounce. The base.
Read also: Bitcoin Maxis Are Ignoring the Biggest Threat Yet
Why This Matters Right Now
Bitcoin’s current price action has been violent, but it’s also familiar. Large drawdowns are normal in this market, even inside long-term bullish cycles. A 40–50% decline is not a black swan event for Bitcoin; it’s historically part of the process.
The real danger is psychological.
Most participants assume the bottom must arrive quickly, because the pain feels unbearable in the moment. But bear markets don’t end when fear begins. They end when exhaustion takes over.
If Mason and Brett are right, then Bitcoin may still need more time in this zone; building a floor, flushing out remaining leverage, and forcing patience onto a market that hates waiting.
The next major move may not come from a single candle.
It may come after months of silence.
Subscribe to our YouTube channel for daily crypto updates, market insights, and expert analysis.