Gold pushing above $5,600 per ounce feels dramatic, especially with social media packed with crash narratives. But the chart shared by analyst Reflection tells a much less emotional story, and a far more consistent one.
The key point in Reflection’s analysis is timing. Gold does not lead market crashes. It follows them.
Looking at the S&P 500 plotted against gold across multiple cycles, the same structure repeats.
During the dot-com bubble (2000–2002), equities peaked first. The S&P 500 lost roughly 50%, while gold barely moved at the start. Only after stocks had already collapsed did gold begin its multi-year advance. The gold rally was a reaction to damage already done, not a warning signal.
The same pattern appears in the 2007–2009 Global Financial Crisis. Equities rolled over, credit broke, and fear entered the system. Gold rose during the crisis, but the larger move came after the bottom, once investors were traumatized and avoided risk. That post-crisis gold trade turned into a trap: from 2009 to 2019, gold went sideways while equities compounded aggressively.
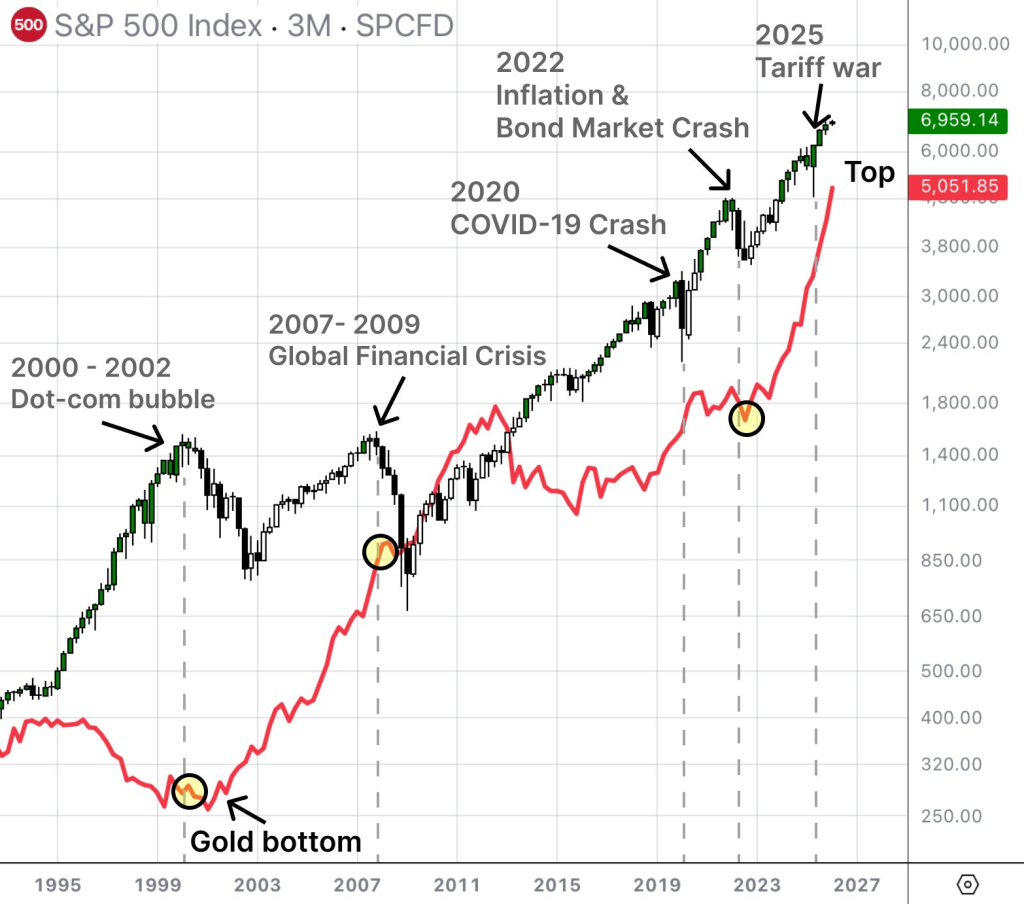
Reflection highlights this clearly on the chart. The red gold line keeps rising long after the crash marker, while equities quietly rebuild and then outperform.
The COVID-19 crash follows the same logic. Gold dipped slightly during the initial liquidation. The real move higher came only after markets had already collapsed and panic had set in. Again, gold responded to fear—it didn’t predict it.
Why Today Looks Similar to Post-2009, Not Pre-Crash
Right now, gold is moving while equities are still holding up. That matters.
The chart labels this phase clearly: after crises, not before them, capital rotates into gold as a psychological hedge. Investors remember pain and choose safety—even when risk assets are already recovering.
That’s exactly what Reflection is warning about.
The current environment is saturated with fear narratives:
U.S. debt headlines, deficit panic, AI bubble talk, tariff wars, geopolitical noise. Gold benefits from that mood. But historically, this mood tends to appear after crashes, not right before them.
On the chart, every time gold became a consensus safety trade without an actual equity collapse, it underperformed for years afterward.
Read also: Robert Kiyosaki Admits Regret Over Bitcoin and Gold as Silver Becomes His Safety Net
The Core Risk Reflection Is Pointing Out
The danger isn’t owning gold. The danger is crowding.
When gold becomes the default response to headlines instead of actual market damage, capital gets parked in an asset that can range for a decade. That happened after 2011. It took almost ten years for gold buyers to see real gains again, while stocks and risk assets compounded relentlessly.
Reflection’s chart doesn’t argue that gold must crash from $5,600. It argues something more uncomfortable:
gold rising does not automatically mean a broader market collapse is coming.
In fact, history suggests the opposite.
Subscribe to our YouTube channel for daily crypto updates, market insights, and expert analysis.