Just a day ago, silver was trading near $99, already forcing traders to rethink where this move might end. Now, price has pushed through $100 for the first time ever and continued higher to $103, extending what is quickly becoming one of the most aggressive moves in the metal’s history.
The speed of the move has shifted the conversation from “how high can silver go” to “how long can this last.”
One analyst now raising red flags is The Great Martis, who shared a chart pointing to technical conditions that have not been seen since the 1980 silver spike.
What you'll learn 👉
What The Great Martis Is Warning About
In his post, The Great Martis describes silver as being in a parabolic phase. That term is often overused, but in this case, the chart backs it up.
Price is moving sharply higher with little pause, and momentum is accelerating rather than cooling off. That is the classic signature of a market that has entered a vertical stage.
Two indicators stand out on his chart.
First, silver is trading roughly 35% above its upper Bollinger Band on the monthly timeframe. That is an extreme reading. Bollinger Bands expand when volatility increases, but price staying that far above the upper band means the market is stretched well beyond its normal volatility range.
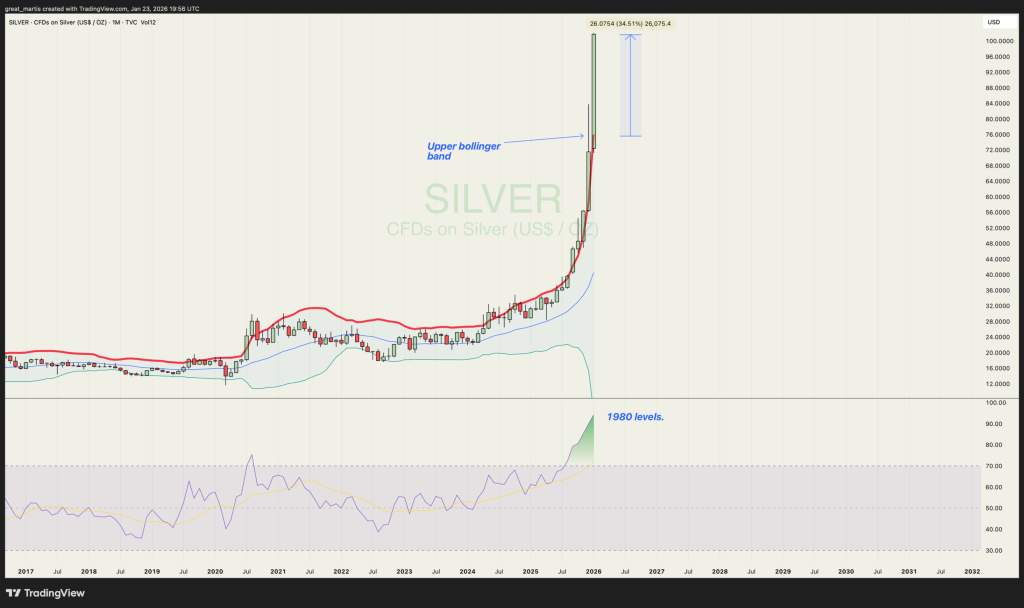
Second, the RSI on the monthly chart is sitting near levels last seen during the 1980 silver blow-off top. That period is remembered not just for how high silver went, but for how violently it reversed afterward.
These are not signals that a move must end immediately. But they are clear signs that the market is operating in a zone where risk rises sharply.
Why Silver’s Move Is Raising Broader Market Concerns
The Great Martis also links silver’s parabolic run to potential stress in equities.
Historically, when silver moves this aggressively, it often reflects deeper shifts in capital flows. Silver does not usually become this stretched unless investors are scrambling for hard assets or pricing in serious macro uncertainty.
In past cycles, similar spikes coincided with inflation shocks, currency stress, or major confidence breakdowns in traditional markets.
That does not mean stocks must crash tomorrow. But it does suggest that silver is reacting to more than just industrial demand or technical breakouts.
It is behaving like a warning signal.
Read also: Silver Price Already Took Off – Now Copper Is Flashing Supercycle Signals
How Realistic Is the Crash Scenario?
While the technicals are extreme, it is important to stay grounded.
Parabolic markets can remain irrational longer than many expect. Silver could still move higher, especially if physical shortages persist, futures delivery pressure continues, or geopolitical risk escalates further.
At the same time, history is clear on one point. When silver reaches these types of technical extremes, it rarely consolidates gently. Moves from these levels tend to resolve through sharp pullbacks or full trend reversals.
The longer silver stays stretched, the more violent the eventual correction usually becomes.
So the risk is not that silver is about to collapse because it hit $103. The risk is that the margin for error is now extremely thin.
Read also: Gold and Silver Rally Sends Fresh Signals Pointing Toward Crypto Altseason
Subscribe to our YouTube channel for daily crypto updates, market insights, and expert analysis.