Bitcoin price flipping back into green has brought short term relief after days of selling pressure. BTC price hovering around $90,000 has made it tempting to assume the correction is already finished. That optimism, however, may be running ahead of what the chart is actually showing.
A closer look at Bitcoin’s structure suggests this bounce could be part of a larger pullback rather than the start of a fresh upside move. The key lies in how BTC price behaved after its most recent rally and where it currently sits relative to historical retracement zones.
That perspective is clearly outlined by CoinsKid, who breaks down the current setup using a long term Bitcoin chart. His focus is not on short term price color, but on the full wave structure that played out before the recent drop.
What you'll learn 👉
Bitcoin Chart Shows A Completed 5 Wave Rally Before The Pullback
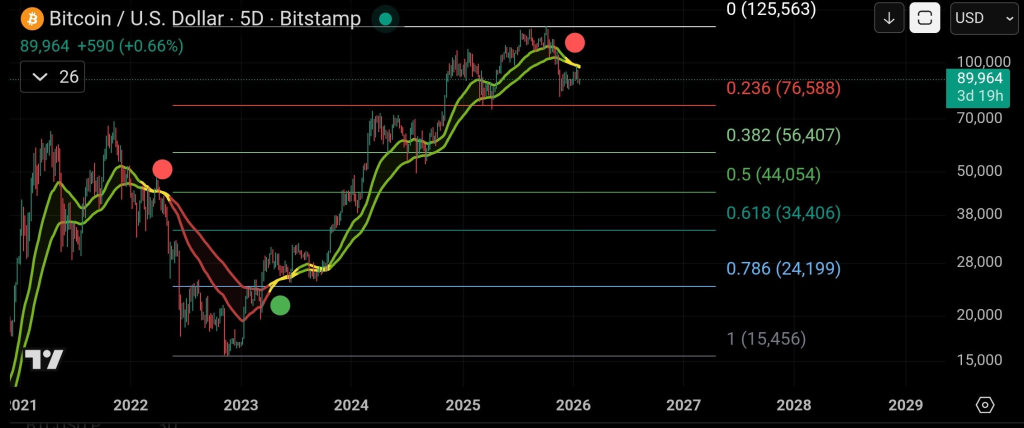
According to CoinsKid, Bitcoin previously completed a full 5 wave impulsive move to the upside. On the chart, that rally ends near the recent cycle high, marked by a clear exhaustion point. Historically, once Bitcoin completes a 5 wave advance, price does not immediately continue higher. A retracement phase usually follows as the market resets.
That retracement is what the current Bitcoin price action represents. The chart shows BTC pulling back from the peak while remaining above several key Fibonacci levels that typically act as support during corrective phases.
BTC Price Has Not Yet Reached Key Fibonacci Support Zones
One of the most important details on the chart is the Fibonacci retracement tool applied from the rally low to the recent high. The first major level, the 0.236 retracement, sits around $76,588. Deeper levels follow at 0.382 near $56,407 and 0.5 around $44,054.
CoinsKid points out that Bitcoin price has not even reached the minimal 0.236 retracement yet. Historically, BTC tends to find support on one of these Fibonacci levels before starting another impulsive move higher. Declaring a bottom while price remains well above these zones goes against how Bitcoin has behaved in past cycles.
Market Structure And Ribbon Signals Still Lean Bearish
Beyond Fibonacci levels, the chart also highlights a loss of market structure. Bitcoin price has broken below its previous bullish structure and fallen beneath the 5 day ribbon. CoinsKid notes that in every prior bearish retracement cycle, BTC did not turn convincingly bullish again until both the ribbon and structure were reclaimed.
The red sell dots shown on the chart reinforce this point. Similar signals appeared during the 2022 correction, which eventually pushed Bitcoin price down to much deeper retracement levels before a sustainable recovery began.
Why Bitcoin Price History Still Favors Patience
A final historical reference stands out on the chart. Bitcoin has never retraced deeper than the 1 Fibonacci level after a completed 5 wave impulsive move. That level sits near $15,456. CoinsKid is not suggesting BTC price will fall that far, but he uses it to emphasize how structured Bitcoin’s retracements have been in the past.
Read Also: Don’t Buy Silver and Gold! Why Chasing This Rally Could Trap You for Years
The broader message from the chart is timing rather than direction. Bitcoin price bouncing higher does not invalidate the retracement phase. Until BTC interacts with key Fibonacci levels and reclaims market structure, the correction remains technically unfinished.
For now, the chart suggests Bitcoin may still be working through a process rather than preparing for an immediate breakout.
Subscribe to our YouTube channel for daily crypto updates, market insights, and expert analysis.