SUI price has spent months moving quietly, then suddenly showed signs of life right where it mattered most. The latest daily chart shows price lifting from a familiar floor, the same area that has acted like a springboard several times before. That detail sits at the center of the current discussion and helps explain why attention is returning to Sui price after a long period of compression.
SUI has been trading inside a descending wedge pattern since late 2025, and that structure has shaped nearly every move since then. Lower highs continued to press price down, while the lower boundary of the wedge kept catching each drop. Each time SUI price touched that base, buyers stepped in and pushed it back toward the upper boundary.
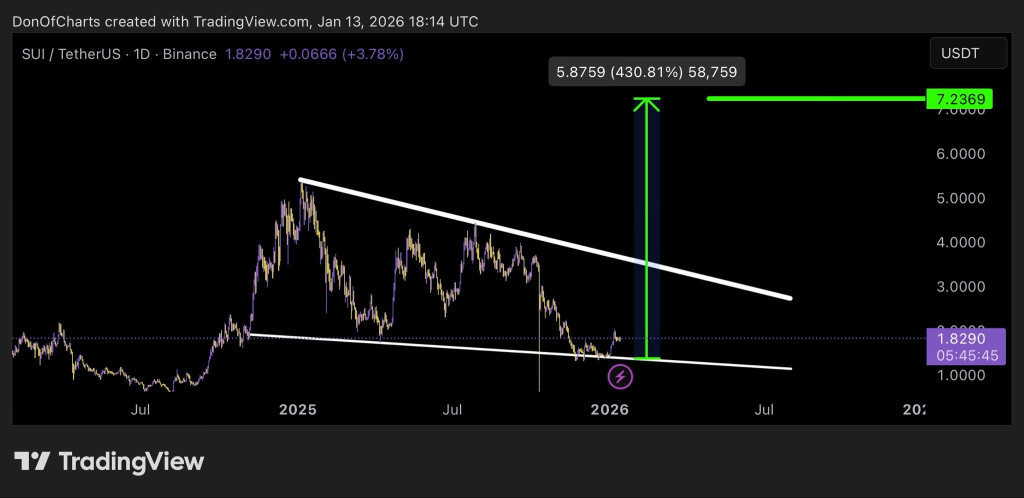
The attached chart highlights this clearly. Price slid down the wedge, tagged the lower trend line, then rebounded sharply. That move has happened more than once, which gives the pattern credibility. Current price action shows another bounce developing from that same zone, suggesting the structure remains active rather than broken.
Sui Insiders pointed to this behavior while noting that $1.60 remains the level holding the entire setup together. That level lines up closely with the wedge base shown on the chart and helps explain why price reactions there have been so consistent.
SUI Price Pushes Toward The Upper Wedge Again
Momentum has shifted back upward following the latest bounce, and SUI price is now moving toward the top of the descending wedge once again. That area has acted as resistance in the past, often slowing price or sending it back down. The difference this time lies in how tightly price has been coiling.
The wedge has narrowed significantly, leaving less room for sideways movement. When patterns reach this stage, pressure tends to build. Sui Insiders described the structure as still bullish as long as the lower support holds, which aligns with the chart’s tightening range.
SUI price currently trades around $1.82, sitting above the base and below the descending resistance. That placement puts price right in the decision zone, where reactions tend to become more decisive rather than gradual.
SUI Price Targets Come Into View If Structure Resolves Higher
A clean move above the wedge would shift the short-term outlook. The chart projection highlights potential upside zones around $2.60, then $4.20, with $7.30 appearing as a longer extension if momentum continues. Those levels were shared by Sui Insiders and match historical reaction areas on the chart.
Read Also: Here Are the Exact Reasons Why Ethereum, Bitcoin, and Crypto Prices Are Up
Price would still need to clear resistance step by step, yet the structure explains why these targets exist rather than appearing at random. Each level reflects previous market memory where SUI price paused or reversed before.
Shorter term price action remains tied to whether the wedge breaks or holds. SUI price staying above $1.60 keeps the pattern intact, while a sustained push through the upper trend line opens the door for a different phase altogether.
Subscribe to our YouTube channel for daily crypto updates, market insights, and expert analysis.