
Solana enters the final days of the year with a calmer tone after a sharp mid-month selloff. Price action on the 2H chart shows SOL sliding from the mid-$140s earlier in December, then printing a quick capitulation wick near $116.7, before stabilizing into a tighter range.
At press time on the chart, SOL trades around $124.7, and the market looks like it is trying to build a base instead of chasing a clean breakout. That kind of behavior often appears when short-term sellers have already done most of their work, but buyers are still cautious about stepping in aggressively.
ETF demand is also back in the narrative. Bitwise’s Solana ETF (BSOL) reportedly opened with $56M in volume on Dec. 28, marking the biggest first-day crypto ETF launch of 2025. While one day of volume does not guarantee sustained inflows, it does show that Solana is firmly on the radar for traditional investors.
If this demand continues into early January, it could act as a stabilizing force during periods of intraday volatility rather than an immediate upside catalyst.
Solana Chart: Key levels to watch this week
The clearest support sits in the $120–$121 area, which has held multiple dips after the $116.7 flush. Buyers have consistently stepped in around this zone, suggesting it is now viewed as fair value in the short term. Below that, $116–$118 remains the line in the sand from the month’s lowest sweep. A decisive break below this region would weaken the current structure and raise the odds of another deeper retracement.
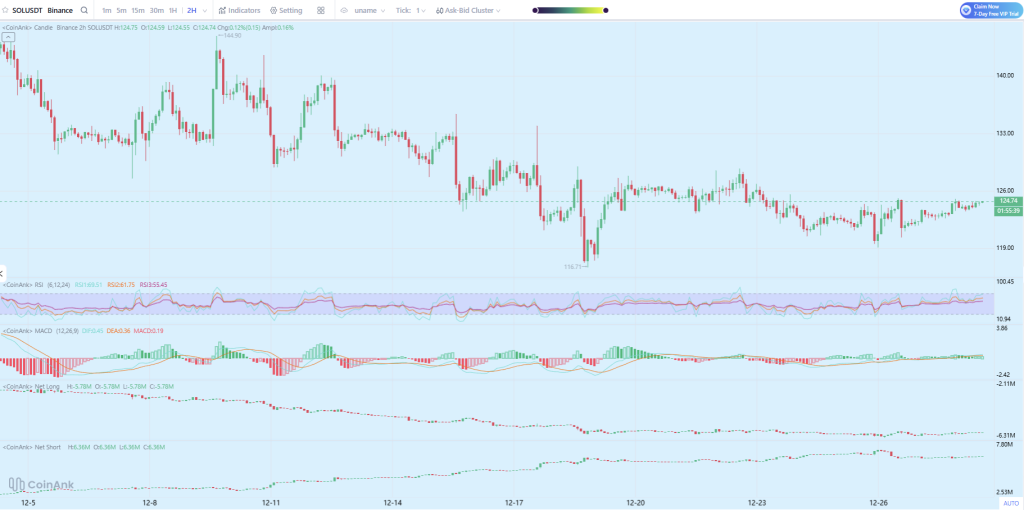
On the upside, $126 is the near-term ceiling, with sellers stepping in around that region several times. The Solana price has tested this level repeatedly but failed to hold above it, which makes it the first area to watch for any bullish continuation. A stronger breakout target sits near $133, which acted as a prior pivot zone before the breakdown and aligns with earlier consolidation from the first half of December.
Momentum indicators lean mildly positive, but not in a way that guarantees follow-through. The RSI cluster on the chart shows the fastest RSI near 69.5, with mid and slower readings around the low 60s and mid 50s. That usually means upside momentum is present, but also close to the zone where short-term exhaustion can appear. Historically, SOL tends to pause or pull back slightly when RSI reaches these levels unless supported by strong volume.
MACD is barely positive, with a small green histogram and closely aligned signal lines. This setup often precedes sideways movement or slow directional pushes rather than explosive trends. It supports the idea that the market is compressing and waiting for a clearer trigger.
Positioning data adds another layer of context. Net longs remain negative, while net shorts are larger and continue to trend higher. This imbalance can cut both ways. On one hand, a sudden push higher could force short covering and produce quick upside spikes. On the other, persistent short interest can also cap rallies if spot demand fails to absorb sell pressure.
Read also: Solana (SOL) Pays $1.4B a Year – So Why Are Validators Quitting?
SOL Price Forecast
For the next 7 days, the base case looks like range trading between $120 and $126, with short-lived moves driven by liquidity rather than strong conviction. A bullish path opens if the SOL price holds above $123–$124 and prints a clean break through $126 on volume, which puts $133 back into focus. A bearish path opens if $120 breaks decisively, which would likely drag price back toward $118 and the $116.7 low for a retest
Overall, Solana appears to be in a reset phase rather than the start of a new trend. ETF headlines provide a supportive backdrop, but the chart still points to patience being required before any larger directional move develops.
Subscribe to our YouTube channel for daily crypto updates, market insights, and expert analysis.