
Zcash price has been having a steady loss of structure that makes the chart harder to ignore. On the 1H timeframe, ZEC price is drifting lower after failing to hold key areas that previously acted as support. The move lines up closely with a technical framework posted by analyst Ardi (@ArdiNSC), who has been tracking subtle shifts in Zcash’s microstructure long before the latest weakness became obvious.
Zcash price recently traded near $411 after spending days compressing inside a tight range. Earlier attempts to push higher stalled, and each bounce started to lose strength. That slow loss of momentum matters. According to Ardi, ZEC price already lost alignment with its short and long term trend structure before the latest dip into lower support zones.
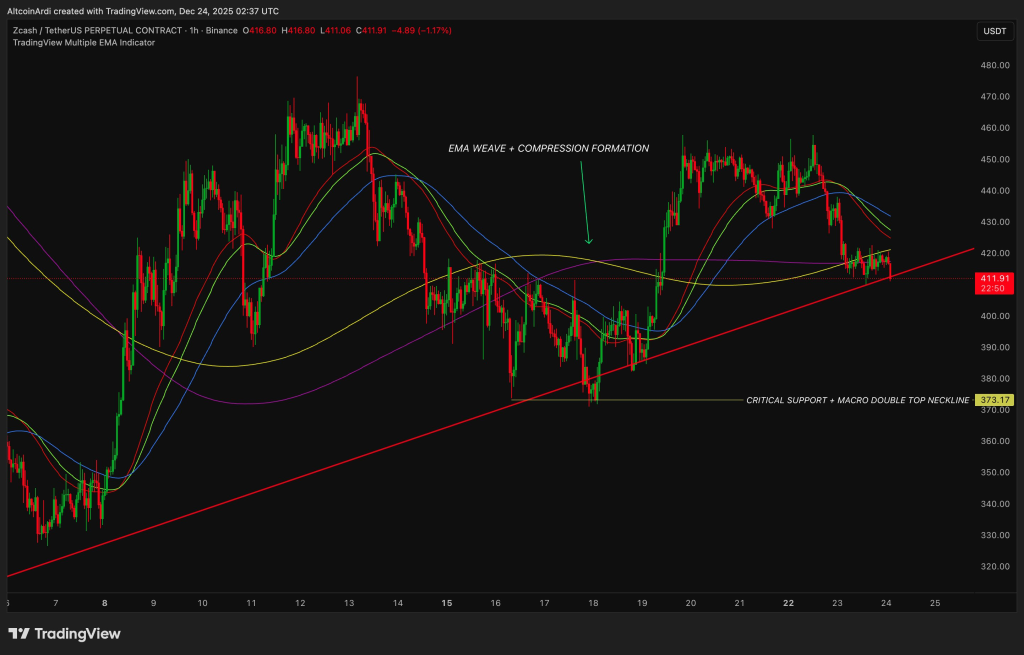
The chart shows price falling below areas that previously held the market together. This type of move does not feel impulsive. It feels planned. Past price action suggests Zcash often weakens in phases like this, where the damage shows up gradually rather than all at once. The visual compression seen earlier on the chart resolved to the downside, putting pressure on nearby trend support.
What you'll learn 👉
ZEC Price Pattern Points Toward A Double Top Scenario
One of the more uncomfortable elements on the Zcash chart is how closely current price action mirrors previous topping behavior. Ardi noted that the structure is lining up with a second potential double top formation. The first instance already played out earlier, with price rolling over well before obvious confirmation signals appeared.
This time, ZEC price is again following a similar script. Price pushed up, stalled near resistance, then slipped lower while momentum quietly faded. The key concern is that the pattern is unfolding before most indicators would traditionally confirm weakness. Historically, that early signal has mattered for Zcash price movements.
A closer look at the chart reveals a rising long term trendline acting as the next major test. That area sits closer to $373, which also aligns with a critical support level tied to a broader double top neckline. Price has not reached that zone yet, though the current structure suggests it may come into focus if weakness persists.
ZEC price hovering above this level keeps the larger structure intact, at least for now. Losing it would shift the conversation entirely. The chart does not show panic, though it does show vulnerability. That combination often creates choppy and uncomfortable trading conditions.
Zcash Indicator Readings Reflect Short Term Uncertainty
Daily chart indicators from investing.com support the idea that Zcash price is in a fragile state rather than a clear trend. The readings below show a mixed environment where momentum struggles to find direction.
| Name | Value | Action |
|---|---|---|
| RSI(14) | 47.192 | Neutral |
| STOCH(9,6) | 63.292 | Buy |
| MACD(12,26) | -17.83 | Sell |
| ADX(14) | 22.571 | Sell |
| ROC | 1.246 | Buy |
RSI hovering near 47 shows ZEC price stuck in no man’s land, lacking strong buying or selling pressure. MACD staying negative points to lingering downside momentum, while ADX below 25 suggests the trend itself remains weak. Short term bounces remain possible, though conviction behind them appears limited.
The daily indicators still lean toward caution. Zcash price has yet to regain strength on this timeframe, and momentum remains uneven. This aligns with Ardi’s view that structural weakness showed up before most traditional confirmations.
Daily conditions like these often result in sideways to lower movement rather than immediate reversals. Until ZEC price reclaims lost structure, pressure remains present beneath the surface.
Long Term Zcash Outlook Looks Healthier On Monthly Timeframe
The longer term picture tells a different story. Monthly indicators for Zcash price paint a much stronger backdrop that contrasts sharply with current short term weakness.
| Name | Value | Action |
|---|---|---|
| RSI(14) | 88.026 | Overbought |
| STOCH(9,6) | 28.955 | Sell |
| MACD(12,26) | 78.3 | Buy |
| ADX(14) | 61.223 | Buy |
| Ultimate Oscillator | 56.448 | Buy |
| ROC | 1013.268 | Buy |
High ADX and positive MACD readings suggest long term momentum remains firmly intact despite near term discomfort. Overbought RSI reflects how far ZEC price has traveled over the bigger cycle, not necessarily an immediate reversal signal. This disconnect between timeframes explains why the current chart feels tense rather than outright bearish.
Read Also: Here’s the Sei (SEI) Price If Network Adoption Keeps Compounding Into 2026
Zcash price is not breaking down aggressively, though it is losing structure in a way that deserves attention. Short-term charts look fragile. Daily indicators remain soft. Long-term momentum still supports the broader trend. That split creates uncertainty, and uncertainty often leads to choppy price action.
Subscribe to our YouTube channel for daily crypto updates, market insights, and expert analysis.