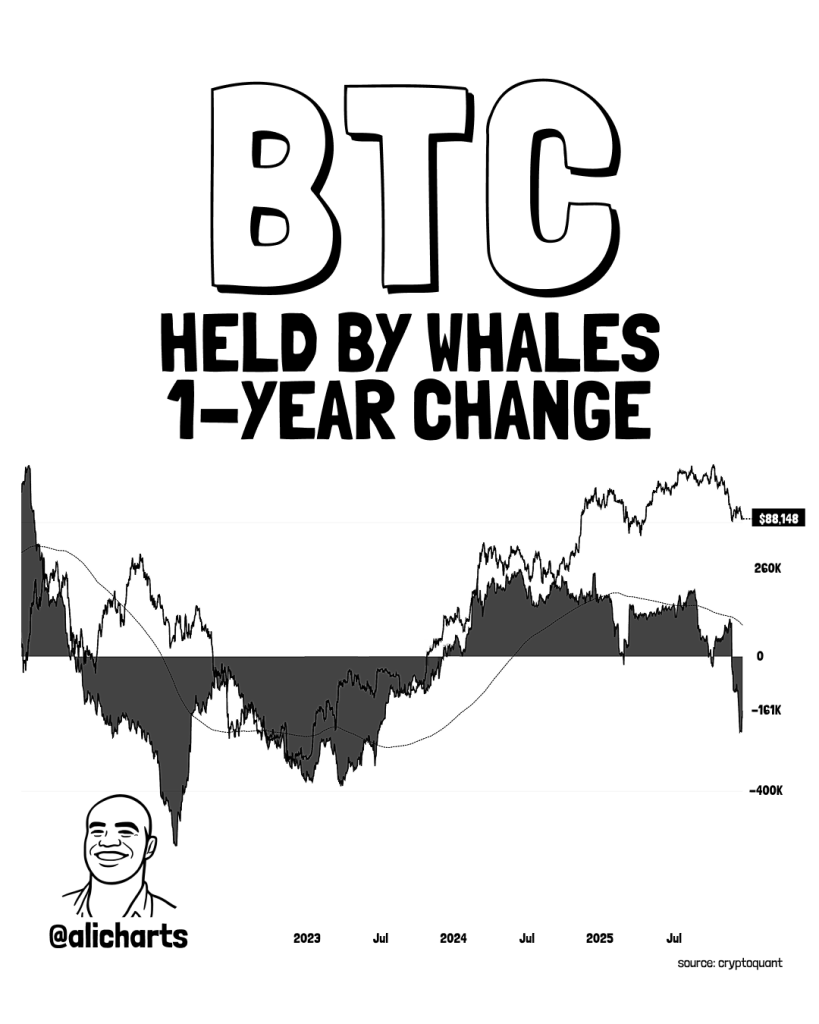
Bitcoin is trading around $88,000, well below its recent all-time high near $124,000. While price has stabilized after the sharp pullback, on-chain data suggests the market may not be out of the woods yet.
A chart shared by Ali Martinez shows that Bitcoin whales have reduced their holdings by roughly 161,294 BTC over the past year. That is a meaningful shift in behavior, and it deserves attention.
The metric tracks the one-year change in Bitcoin held by large wallets. Right now, that figure sits deep in negative territory. In simple terms, whales have been net sellers for an extended period.
This type of behavior usually appears before or during deeper corrections, not after a clean bottom. When long-term large holders distribute into strength, it often reflects caution rather than confidence. They are not chasing upside. They are managing risk.
That does not mean a crash is guaranteed. It does mean the market is still in a distribution phase rather than a clear accumulation phase.
What you'll learn 👉
Context Matters: This Is Not Panic Selling
It is important to separate steady selling from panic. The chart does not show a sudden dump. It shows consistent net outflows over time.
That pattern fits what price already told us. The Bitcoin price pushed to a $124,000 high, failed to hold momentum, and then corrected sharply. Since then, price action has been choppy, not impulsive. Whales appear to be selling into rallies rather than capitulating at lows.
From a market structure perspective, that keeps pressure on upside moves and limits how fast price can recover.
Why This Matters at $88K
Bitcoin sitting at $88,000 still looks strong on a long-term chart. On a shorter horizon, however, the context changes. This is a market that already corrected hard, yet whales have not flipped back to net buyers.
Historically, durable bottoms tend to form after whale selling slows down or reverses. Until that happens, rallies remain vulnerable to rejection.
Ali Martinez’s point is straightforward. This data usually does not show up after the worst is over. It tends to appear while the market is still working through excess optimism from the prior move.
Read also: The Next 7 Days Could Define Bitcoin’s Entire Market Direction
Retail vs. Smart Money Dynamics
Another angle worth noting is who is buying. ETF inflows and retail participation continue to support price, but that demand is being met by supply from larger holders.
That creates balance, not momentum. Price can move sideways or grind lower even while headlines remain positive. This is often the phase that frustrates both bulls and bears.
In that sense, the current setup explains why Bitcoin has struggled to regain traction despite strong narratives earlier in the year.
What Would Change the Picture
The key signal to watch is a shift in whale behavior. A flattening of this metric, followed by a move back toward accumulation, would suggest distribution is ending.
Until then, caution is reasonable. Bitcoin does not need to collapse to reflect this data. It simply needs to remain volatile and range-bound while the market absorbs supply.
At $88,000, Bitcoin is no longer overheated, but it may not be finished correcting either. Whale behavior supports that view.
Subscribe to our YouTube channel for daily crypto updates, market insights, and expert analysis.