
Aster price has been sliding hard, and the chart has not been subtle about it. ASTER price is now down more than 50% from its November 2025 high near $1.5, leaving many holders wondering what exactly is driving this steady decline and why every small bounce keeps failing.
The answer sits less in headlines and more in positioning, behavior, and liquidity. Analyst Ardi, known on X as @ArdiNSC, breaks down what is happening behind the scenes, and the picture is far more mechanical than emotional.
ASTER price has been in a defined downtrend, and the chart has consistently signaled lower highs and lower lows. Aster price structure never shifted into a confirmed reversal, yet bullish positioning kept building anyway.
Ardi explains that the core issue is not a sudden shock or aggressive selling event. The problem comes from traders refusing to accept the trend that the chart is already showing. ASTER price bounces of around 2% repeatedly attracted aggressive long positions, even though the broader structure never improved.
Each bounce looked tempting on the surface, yet the downtrend remained intact. The chart never showed strong demand returning, and that disconnect set the stage for what followed.
What you'll learn 👉
Aster Price Bounces Have Been Fuel For Liquidations
Every small Aster price bounce created the same pattern. Traders attempted to front run a bottom by longing early, hoping to catch the reversal before it arrived. That behavior added leverage on the long side without adding real buying strength.
According to Ardi, those longs quickly became trapped once price rolled over again. Liquidations followed, pushing ASTER price into the next support level. The cycle then repeated itself, with each failed bounce creating new forced selling.
The chart reflects this clearly. Sharp downward candles often follow brief relief moves, showing how long positions are being unwound rather than fresh shorts pushing price lower.
ASTER Price Selling Pressure Is Coming From Trapped Longs
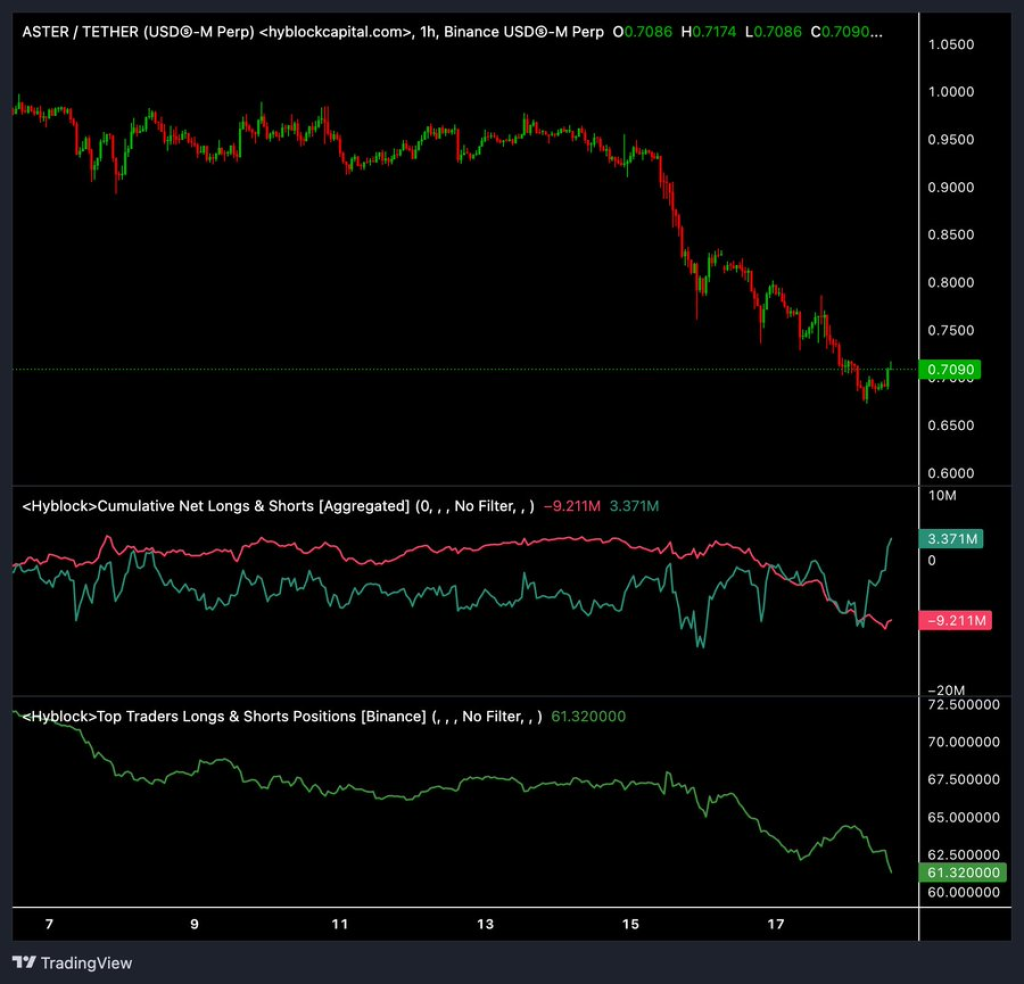
One of the most important details Ardi highlights comes from positioning data. Cumulative Net Shorts has stayed relatively flat during this decline. That detail matters because it shows this is not a coordinated short attack driving ASTER price down.
Selling pressure is instead coming from longs being forced out of positions. When price drops and no strong buyers step in, trapped longs have only one option left, which is to sell into thin liquidity.
This explains why ASTER price keeps sliding even without a surge in short interest. The chart shows weakness because demand is missing, not because shorts are overwhelming the market.
Aster Price Shows Professionals Stepping Aside
Binance positioning data adds another layer to the story. Ardi points out that the top trader long ratio dropped from 70% to 61.3% in just one week. That shift signals professional traders actively reducing exposure while price continues to fall.
Aster price action reflects that withdrawal. Experienced participants appear to be stepping aside and allowing retail positioning to absorb the downside. The imbalance remains heavy on the long side, yet real buyer support continues to fade.
The chart mirrors this behavior through declining volume on bounces and sharper selloffs when support breaks.
ASTER Price Is Now Testing Critical Support Levels
ASTER price is currently attempting to hold the $0.70 support area. That level stands out clearly on the chart as a zone where price previously paused. Holding it would require real demand stepping in, not just leveraged longs hoping for a bounce.
Ardi warns that failure at this level could quickly expose the $0.61 lows. Many late bullish positions are clustered above current price, meaning another breakdown could trigger a fresh wave of forced selling.
The chart already shows how fast ASTER price can move when liquidity disappears. Without a meaningful shift in positioning and buyer strength, downside momentum can accelerate quickly.
Read Also: Top Analyst Starts Accumulating Chainlink (LINK) Again Amid Market Panic: Here’s What He Sees
ASTER price is not falling because of rumors or sudden panic. The decline reflects structural pressure created by persistent long imbalances and a lack of genuine demand. Ardi’s analysis shows a market grinding lower under its own weight rather than collapsing from an external shock.
Charts often tell uncomfortable stories before they tell hopeful ones. Aster price remains stuck in that phase for now, where behavior and structure matter more than optimism. How price reacts around current support will likely determine whether this cycle finally exhausts itself or continues a little longer.
Subscribe to our YouTube channel for daily crypto updates, market insights, and expert analysis.