Zcash ZEC price has seen a 50% rally in the past one week. It is trading around $456.49 at the time of writing. Momentum has come back into the Zcash token market after a period of slow movement, and the chart shared by Mayank Dudeja, a crypto analyst shows exactly how this climb has been unfolding.
A clean rising channel has been guiding ZEC through higher highs and higher lows, creating a structure that traders often look for when trying to understand whether a rally still has room to stretch.
ZEC token has been rising inside a clearly defined channel on the 2H timeframe. Mayank Dudeja captured this structure in his update, showing how each dip has respected the lower trendline while each push upward has tapped or approached the upper boundary. The overall Zcash price trend looks organized and steady rather than chaotic, which gives traders a sense of how price may behave in areas where reactions have happened before.
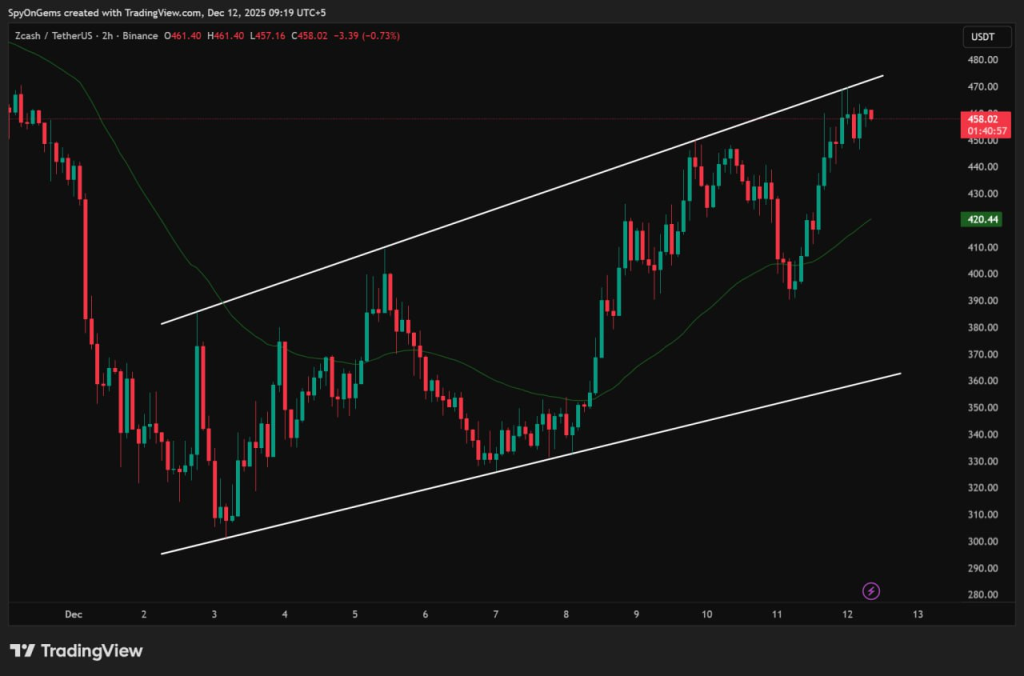
Zcash price now sits right at the upper channel resistance. The attached chart brings this into focus: candles have climbed sharply from the lower boundary near $360, moved through the midline region that sits close to $420, and are now pressing into an area where ZEC has repeatedly stalled in previous moves. Every test of this upper trendline has triggered reactions, so traders tend to watch this zone closely.
Zcash Token Enters a Reaction Zone Traders Know Well
ZEC has been showing strength as long as price holds above the midline. Mayank Dudeja pointed out that the $420 region acts like a balance point between the higher boundary and the lower demand zone near $360. Movement above that midline keeps the structure bullish because it signals buyers are still defending higher lows.
The challenge appears when price reaches the top of the channel. The chart shows ZEC tapping this resistance again, and each candle around this level becomes important. Price is not collapsing, which reinforces the strength of the trend, yet the proximity to this familiar ceiling introduces pullback potential. A trend can stay strong while still producing short term reactions, especially when many touches of the same resistance have occurred.
Zcash Price Outlook as Structure Tightens
ZEC remains in its bullish pattern, yet the setup shared by Mayank Dudeja shows that momentum is now meeting a decision point. The Zcash token can stay inside this channel for days or even longer, creating swings between midline and resistance. That is what the structure has been doing since early December on the displayed chart.
The key question many watchers could have is whether Zcash token can push through the upper boundary or whether the channel will enforce another corrective move. Price action so far suggests the trend is still healthy, although reaction zones do not typically pass unnoticed. A clean break above the resistance line could shift the narrative, while a pullback toward the midline near $420 keeps the channel intact without breaking the broader move.
Read Also: Kaspa (KAS) Pulls Off a 24-Hour Plot Twist as Core Team Steps In to Save Key Infrastructure
ZEC price is showcasing strength, yet the ceiling overhead continues to shape expectations. The clarity of this rising channel makes it easier to understand where Zcash may react, and the chart from Mayank Dudeja surfaces that point clearly. Every touch at the upper boundary has carried sensitivity, and price is touching that region again.
Zcash continues to build its trend step by step, although the familiar ceiling remains the factor shaping short term behavior.
Subscribe to our YouTube channel for daily crypto updates, market insights, and expert analysis.