Solana is moving into a key area as price approaches the $124 support Ali Martinez pointed out. After slipping out of the mid-$140s, the SOL price has been sliding steadily, and the break below $136–$138 shows sellers are controlling the action.
Ali’s chart hints that the SOL price could drift down to $124 next, a level that has held before and is now back on traders’ radar with price sitting in the low $130s.
What you'll learn 👉
The SOL Chart Shows a Clear Breakdown Structure
Ali’s one-hour chart makes the current trend easy to understand. The Solana price drop from the $144 area shows how quickly bullish momentum faded, and every bounce since then has formed a lower high. That’s a classic sign that sellers are still in control.
The key moment was the break below the $136–$138 zone, a level that acted as support multiple times. Once it failed, SOL had room to drift lower without much resistance.
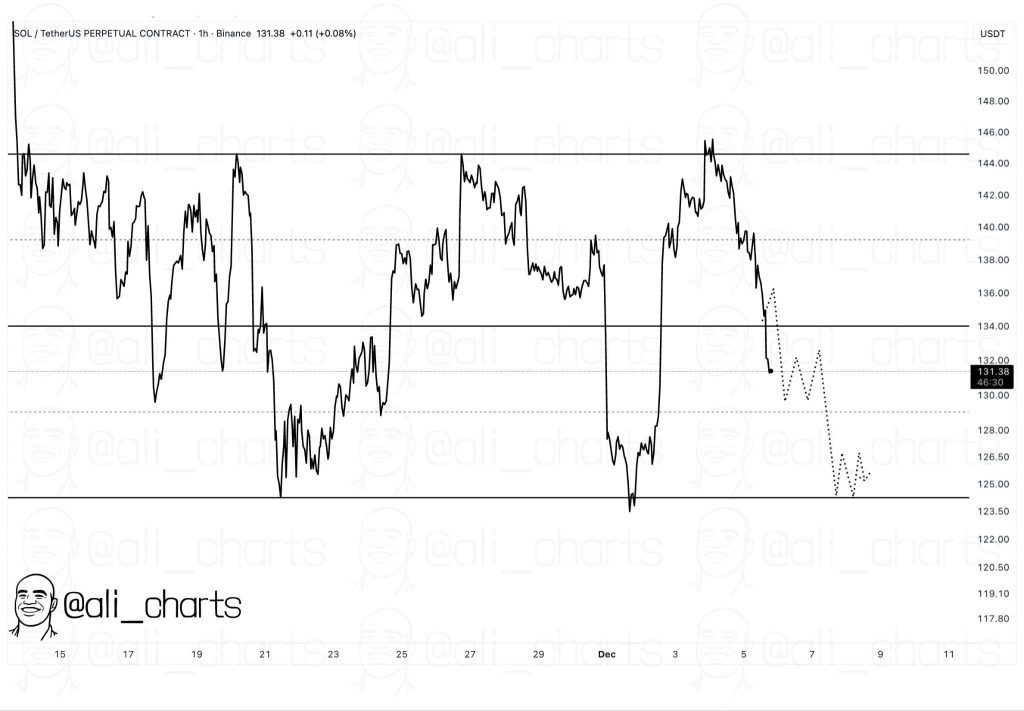
The dotted path on Ali’s chart outlines a simple scenario: price could continue sliding toward $124, then bounce around that level before the market decides its next direction. That $124 zone has been a pivot in past corrections, which is why many traders expect buyers to show interest there again.
The bigger takeaway from Ali’s structure is that the Solana price isn’t crashing; it’s moving through a controlled downtrend. If $124 holds, the trend can reset. If not, SOL may need to probe lower levels before finding a stronger base.
Read Also: Sui Matches Solana but Trades at a Fraction of Its Market Cap
A Whale Makes a Big Move Behind the Scenes
While the market pulls back, on-chain activity is getting interesting. Lookonchain spotted a whale creating a fresh wallet “8TGzUb”, and immediately withdrawing 499 SOL, around $69.8K, from Bybit.
Instead of holding that SOL, the whale rotated almost the entire amount into 74.3 million TBY tokens in one single transaction.
A whale just created a new wallet, 8TGzUb, withdrew 499 $SOL($69.8K) from #Bybit to buy 74.3M $TBY in a single transaction.https://t.co/WSNkIkmqqB pic.twitter.com/Pc3qDmTOT2
— Lookonchain (@lookonchain) December 5, 2025
The Solscan dashboard shows the transfers clearly: SOL hits the new wallet, and moments later, it’s swapped for TBY. Moves like this don’t directly change Solana’s chart, but they do show that large players are active during the pullback.
Whales tend to make adjustments when they expect volatility, or when they see an opportunity forming, and that often happens near important technical levels.
What to Expect Next for SOL
The big question now is whether Solana can actually hold the $124 support when the price gets there.
If buyers show up the way they did on previous dips, this area could become a solid bounce point and give SOL a chance to reset. If not, the market may slide deeper before stabilizing.
For now, traders are watching two things: how quickly the SOL price approaches $124, and whether on-chain signals like this whale activity start picking up even more.
Whales buying, selling, or rotating positions during a pullback often hints that a larger move is building underneath the surface.
Solana isn’t in danger yet, but the next reaction around $124 will likely set the tone for what comes next. Buyers defended this area before, and Ali’s chart indicates they may try again soon.
Subscribe to our YouTube channel for daily crypto updates, market insights, and expert analysis.