Certain charts feel like they are whispering a familiar story, and Monero (XMR) has been doing exactly that. The market moves quietly, pauses, tightens up, and suddenly bursts into a clean rally. A crypto analyst known as make sense on X pointed out that the same structure has appeared again. The chart he shared shows a pattern that looks almost like a replay of earlier expansions.
XMR trades around $406 at the time of writing. The structure on the chart from make sense shows tight compression forming at the trendline once more. Each time XMR created this pattern inside the channel, a rally followed. The newest squeeze sits right on the support line which makes the setup even more interesting.
What you'll learn 👉
How the XMR Price Structure Mirrors Earlier Movements
The rising channel on the chart captures a rhythm that keeps repeating. Price dips toward the lower trendline. Candles squeeze together. Volatility drops. Momentum builds under the surface. This happened several times and make sense circled each one to show how similar they look.
Compression phases appear like calm pools of water before a wave forms. The first cluster on the left of the chart produced a clean push. The second one did the same. The third cluster sparked another breakout. Every burst followed the same formula that the analyst described.
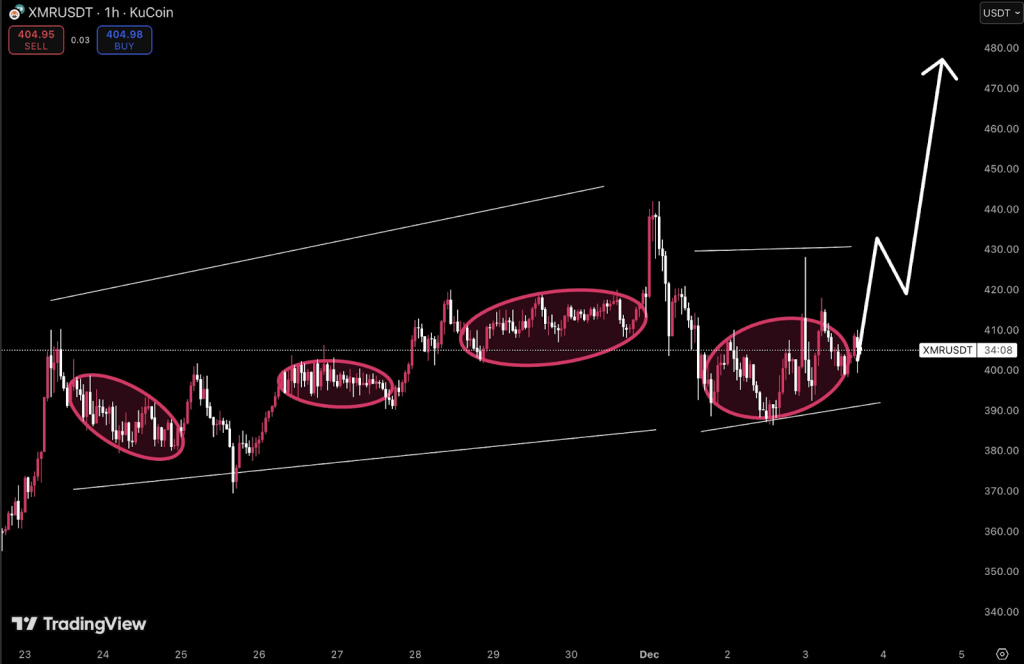
A new accumulation pocket is forming at the trendline again. The candles are tight and slow which mirrors the earlier phases almost perfectly. XMR appears to be drifting off that zone already which matches how previous expansions began. If the rhythm continues, the analyst noted that a clean move could aim toward the $460 region. Nothing is promised although the pattern remains consistent inside the channel.
The Monero token has behaved this way for several days. Higher lows form a staircase pattern that strengthens the case for controlled accumulation. The current pocket of compression fits neatly into this long timeline and that is exactly what make sense wanted to show through the chart.
Why This Matters for the Monero Price Story
This structure suggests more than just sideways action. XMR often climbs through a methodical build up where buyers absorb supply quietly. The lower trendline captures this behavior clearly. Sellers push the price down but buyers step in at the same region repeatedly. This creates a type of rhythm unique to the XMR token.
The Monero price keeps bouncing inside the same channel which reflects confidence and stability. Each compression pocket shows how the market gathers strength before making its next move. The new pocket fits the pattern identified by the analyst, which strengthens the idea that momentum may be preparing for another shift.
Daily Indicators From Investing.com Supporting the XMR Move
Momentum indicators on Investing.com paint a picture that supports this chart structure. Values lean toward the upside without showing signs of exhaustion. This is the type of environment where accumulation becomes meaningful because the market shows balance rather than weakness.
Here is the table showing the readings.
| Name | Value | Action |
| RSI(14) | 55.01 | Momentum leans upward while buyers keep steady control |
| STOCH(9,6) | 60.161 | Market shows firm bullish pressure developing gradually |
| STOCHRSI(14) | 53.547 | Momentum rests in a balanced zone that fits accumulation |
| MACD(12,26) | 14.942 | Bullish strength builds as the trend slowly gains traction |
| Ultimate Oscillator | 52.723 | Buying pressure stays healthy without pushing extremes |
These readings blend smoothly with the structure noted by make sense. The market shows enough strength to continue building without tipping into overbought territory. The compression zone at the trendline matches this perfectly since accumulation thrives when momentum is steady rather than aggressive.
Read Also: Fed Ends Quantitative Tightening: Why Shiba Inu (SHIB) Could Be Set for a Major Turnaround From Here
XMR has a history of forming the same setup before its strongest pushes. The analyst’s chart makes this clear with the compressions, drifts, and expansions. The sequence is almost rhythmical. The new cluster at the trendline continues that story, which keeps attention on the Monero token as the market decides its next step.
Subscribe to our YouTube channel for daily crypto updates, market insights, and expert analysis.