Something shifted on the HyperLiquid (HYPE) chart this week. HYPE bled for nearly a month and suddenly saw a reaction that felt different. The candle structure finally pushed back after sliding from roughly $54 to about $35, a move that wiped nearly 35% in 30 days. Hyperliquid has never been a quiet token, the past weeks gave it one of its heaviest periods of pressure.
Make Sense, a crypto analyst on X, believes this may be the moment the market sets the foundation for a larger move. His roadmap walks through each zone HYPE must reclaim, and the charts back his reasoning step by step.
What you'll learn 👉
HYPE Price Beginning to Stabilize as Structure Firms Up
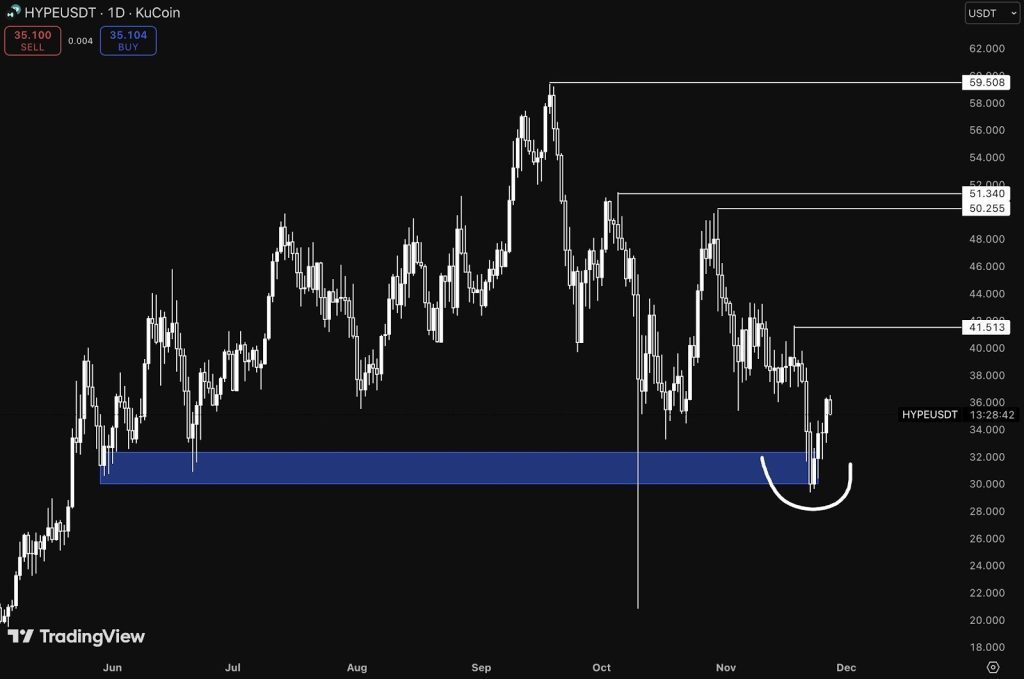
The 1D chart tells the first part of the story. The drop that stretched across November kept breaking low after low, yet the latest interaction around the $30 to $32 zone finally produced a rounded reaction instead of another clean breakdown. A clear rebound formed, showing buyers defending a zone that has held more than once in previous cycles.
Make Sense points to this as the first real change in behavior. The structure is no longer sliding without resistance. The candles are reacting with strength again. He argues that this is usually the earliest sign that momentum wants to shift after extended pressure.
Hyperliquid price trading around $35 creates the midpoint of this reaction. Movement above it begins the climb toward the next decision level.
HYPE Token Facing First Checkpoint Around $37 to $38
The 4H chart gives clarity on the checkpoint, Make Sense calls the trigger zone. The zone between $37 and $38 acted as the breakdown point that sent Hyperliquid price into its fast selloff. Liquidity sits there from trapped sellers who exited in panic.
Movement back into that block forces those traders to react. According to the analyst, reclaiming it squeezes that cluster and gives HYPE the pressure needed to open the next leg.
The chart shows a small fair value gap sitting just below that zone, which explains why price keeps gravitating toward it. Once reclaimed, the pathway becomes smoother.
Hyperliquid Token Entering the Thin Region Toward $41 to $42
The next section on Make Sense’s roadmap involves the zone between $41 and $42. The 4H chart shows this area stacked with inefficiency. Nothing heavy sits there because the previous selloff moved through it too quickly, leaving little structure.
HYPE entering that area tends to move efficiently through it. That is why Make Sense sees little in the way of resistance here. Once Hyperliquid moves beyond $38, this region becomes the natural magnet.
HYPE Preparing for the Momentum Pivot at $44
Momentum always changes at a mid-range level, and for the HYPE token that level is $44. The chart marks it clearly. Every strong reversal retakes its midpoint before accelerating, and Make Sense frames this as the moment Hyperliquid transforms from recovery to controlled trend.
The 4H chart reflects this logic. The swing structure compresses just under $44, and flipping that level resets the entire model from a bearish sequence to a bullish one.
Hyperliquid Entering the Clean Runway Toward $48 and $50
The final blocks above $44 contain the untouched liquidity Make Sense emphasizes throughout his thread. The 4H chart shows a broad, uninterrupted region leading straight to $48 and finally to $50. This area holds no major reaction points, which often means price travels quickly once it enters.
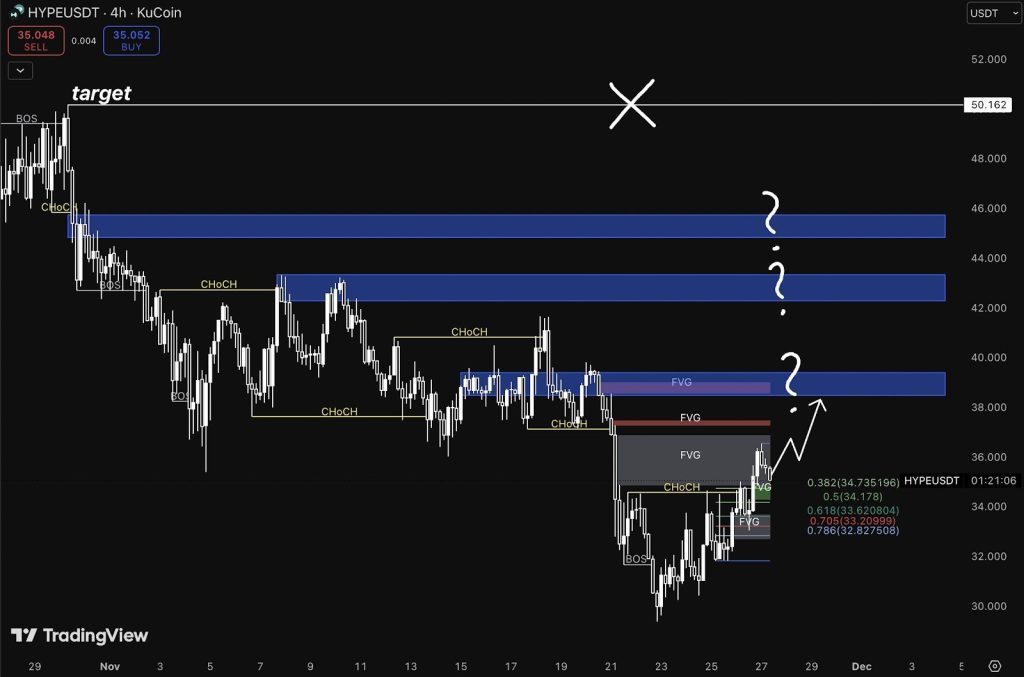
Make Sense marks $48 as the start of the last push and $50 as the point the entire roadmap is designed to reach. That level is where long-term sellers left their liquidity untouched. Market structure often gravitates to such areas eventually, especially after a strong recovery.
Hyperliquid moving from roughly $35 to $50 may look ambitious at first glance, yet the chart structure gives every step of that path a logical sequence.
Read Also: Shiba Inu to Carry Out Another Upgrade: Could This Finally Save SHIB Price?
Hyperliquid has not solved its volatility, yet the structure has changed enough to spark curiosity again. Make Sense’s roadmap lays out a clean journey, one checkpoint at a time, without ignoring the risks or the work the chart still has to do.
Subscribe to our YouTube channel for daily crypto updates, market insights, and expert analysis.