
Chainlink (LINK) price has entered a tense moment on the chart, and analyst Ali’s latest update captures exactly why traders are starting to worry.
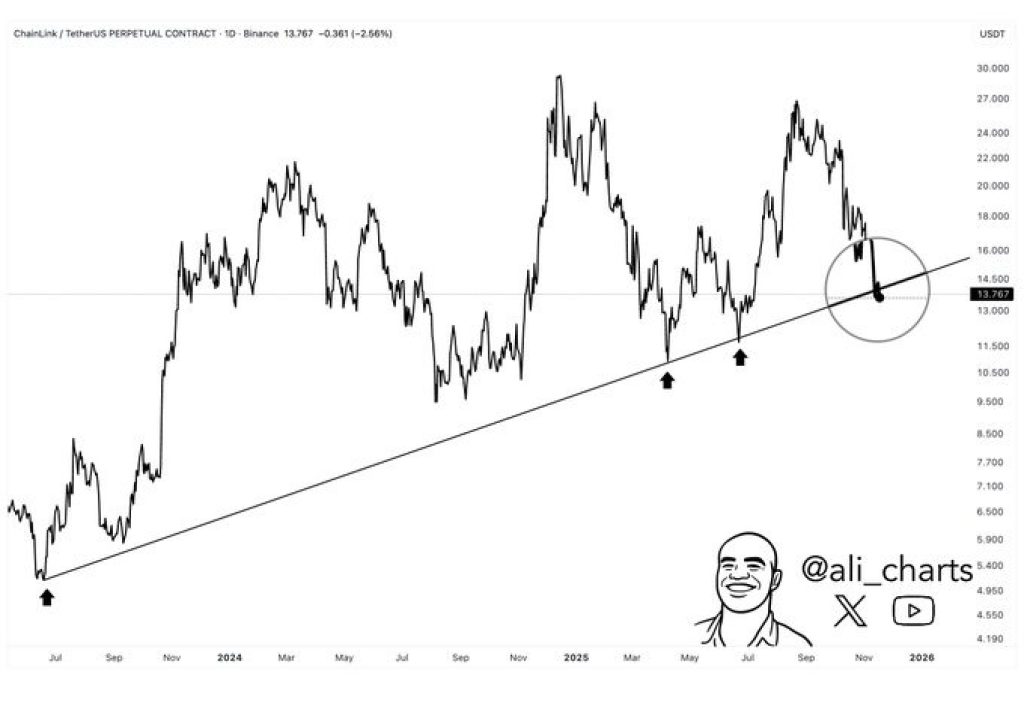
LINK is trading around $13.70, but the real story isn’t the daily move; it’s the long-term support level that has protected the price for more than two years. That same trendline is now being tested again, and the market feels noticeably unsure about whether it can hold.
This ascending support has caught every major dip since July 2023, acting almost like a safety net for the LINK price during rough market periods.
This time, though, the price isn’t bouncing off it with the same strength. Instead, it’s sinking toward the line and hovering there, which is rarely a good sign.
Top analyst Ali points out that the LINK price is now genuinely at risk of losing this long-term trendline, and the chart he shared makes the situation very clear.
The past touches on this line led to sharp rebounds, but the current price action looks more tired. Lower highs continue to press down on the chart, and LINK hasn’t shown the kind of aggressive reaction you’d normally expect near such an important level.
The worrying part is how flat the Chainlink price has become right on the trendline. When buyers are confident, the asset usually springs upward on first contact. This time, there’s hesitation, and hesitation near a major support often sets the stage for a breakdown.
What the LINK Chart Is Showing
A closer look at the chart shows a structure that has weakened over recent weeks. Since the peak in October, the LINK price has been printing lower highs, with every small bounce seeming to run out of steam quickly.
Trading volume hasn’t picked up either, which makes it harder for bulls to force a reversal. Instead of bouncing away from the support, the price keeps leaning on it. When that happens, it usually means sellers are still in control.
If the LINK price fails to hold this line, the next stop on the chart sits much lower, which is why traders are paying so much attention to this exact moment.
Read Also: Here’s Why SUI Price Is Still Stuck in a Downtrend
LINK Price Short-Term Outlook
The next move likely depends on whether the Chainlink price can defend this trendline. If buyers can step in and push the price back toward $15, then the chart will begin to look healthier and a move back toward the $17–$18 area may be seen. That keeps the long-term uptrend intact and gives bulls something to work with.
If the trendline fails, the picture changes quickly. A breakdown would expose the LINK price to the $11 region first, and potentially $9 if selling pressure accelerates.
Losing a multi-year support level tends to send a strong signal to the market, and it usually brings more volatility with it.
For now, everything comes down to that single diagonal support. Hold it, and the LINK price gets another chance. Lose it, and things could turn ugly in a hurry.
Subscribe to our YouTube channel for daily crypto updates, market insights, and expert analysis.