Cardano price has been under pressure for weeks now. The current price sits around $0.57 after a drop of over 20% in recent weeks. A clear line on the chart from Ali hints at where a rebound might begin, and that is why this story matters to anyone watching ADA token right now.
Ali posted a daily chart that draws a simple scenario. Price bounced from a low and climbed back toward the $0.60 area. That bounce left a visible wick down near $0.50 a few sessions ago. Ali marked $0.50 as support.
The chart suggests a path where price could slip again toward $0.50 before finding footing. A move down to $0.50 would keep the possibility of a larger rebound open toward $0.70. Chart shows a potential short leg lower first, then a stronger push higher if support holds.
$0.50 sits at a level where buyers showed interest before. Failure to hold $0.50 would open room for more downside. Holding $0.50 would leave the door open for a recovery up to $0.70. Ali refers to $0.50 as a must-hold level.
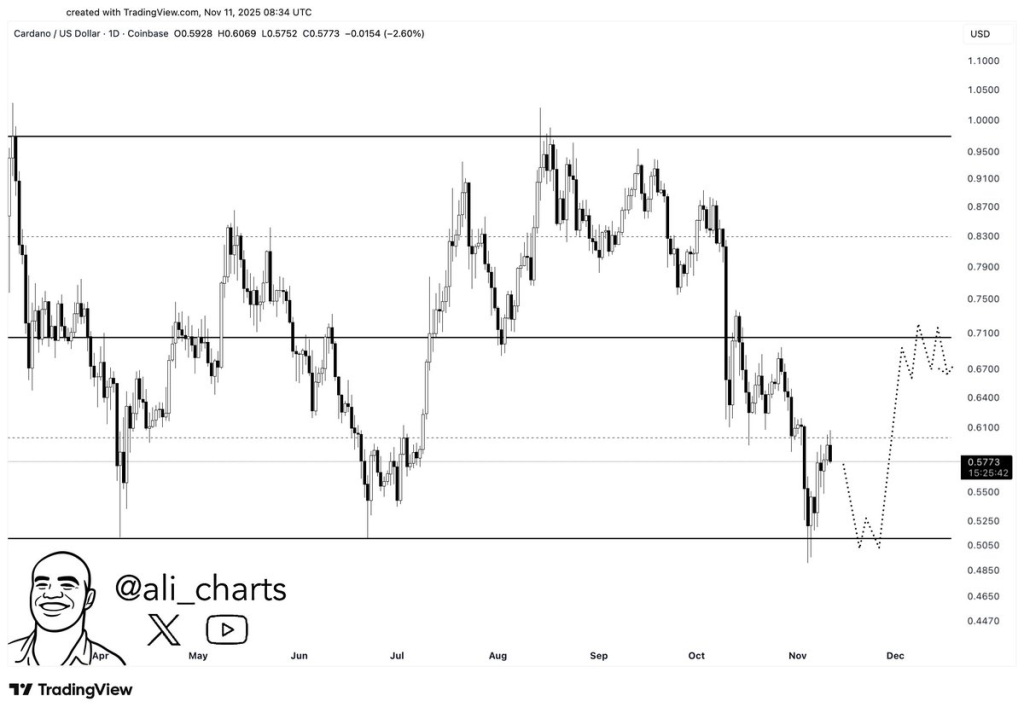
This makes the $0.50 level a zone many will watch on the daily charts. The chart’s dotted path sketches two scenarios: one where price briefly tests $0.50 and then climbs, and another where price chops around near $0.70 if upward momentum gains steam.
Reading the Daily Indicator Table for ADA Price
Here is the technical indicators from the daily timeframe from investing .com to explain ADA price action
| Name | Value | Action |
| RSI(14) | 40.377 | Momentum sits below neutral and points to weaker buying pressure; price may struggle to push higher until momentum improves |
| STOCH(9,6) | 62.588 | Stochastic shows momentum trying to pick up which could support a short term bounce if price holds above support |
| MACD(12,26) | -0.038 | MACD remains slightly negative indicating trend bias favors sellers; a crossover would be needed to confirm trend flip |
| ADX(14) | 32.102 | ADX above 25 signals trend strength which currently appears to favor the down move; trend intensity could keep price pressured |
| Ultimate Oscillator | 52.622 | Ultimate Oscillator sits around neutral to mildly bullish which allows for countertrend rallies if support holds |
RSI below 50 shows momentum currently leans toward sellers. This aligns with the price pullback seen on Ali’s chart. STOCH sits above 50 and points to some recovery attempts. That suggests short-term rallies can happen even while overall momentum is weak.
MACD below zero keeps trend bias on the negative side. ADX reading above 30 shows trend strength has been meaningful which explains why price fell sharply through previous support zones. Ultimate Oscillator hovering near the middle gives room for bounce attempts, especially if price finds support near $0.50.
If price slips toward $0.50 and shows a strong rejection there, STOCH and Ultimate Oscillator would likely respond first, picking up momentum for a short-term lift. Full trend change would need MACD to turn positive and RSI to climb above 50. ADX would then need to fall below 25 before a clean trend reversal is accepted by many charts.
Read Also: Top Analyst Is Confident ZCash (ZEC) Price Will Crash Back Below $100: Here’s Why
What Could Unfold Next for ADA
Current price action implies two clear paths. One path brings the price down to test $0.50. Support could hold and trigger a rebound toward $0.70. That rebound would likely be choppy and may form a range around $0.70 as shown on Ali’s projected path.
An alternate path could break $0.50 and extend losses, leaving buyers to defend lower levels.
Subscribe to our YouTube channel for daily crypto updates, market insights, and expert analysis.