Solana might be about to close out a busy October. The SOL price tried to push higher early in the month but struggled to hold above the $230–$240 zone.
A market-wide pullback then hit SOL at the end of October, dropping it around 6% and pushing it back toward a major support area near $180.
Even with that sell-off, Solana continues to attract strong institutional attention. Its recently launched U.S. ETF recorded the highest opening-day volume of the year with $56M traded, and Western Union’s move toward a Solana-based stablecoin reinforces real-world adoption.
At the same time, macro pressure from U.S. rate concerns still keeps volatility high going into November.
What you'll learn 👉
What the SOL Chart Is Showing
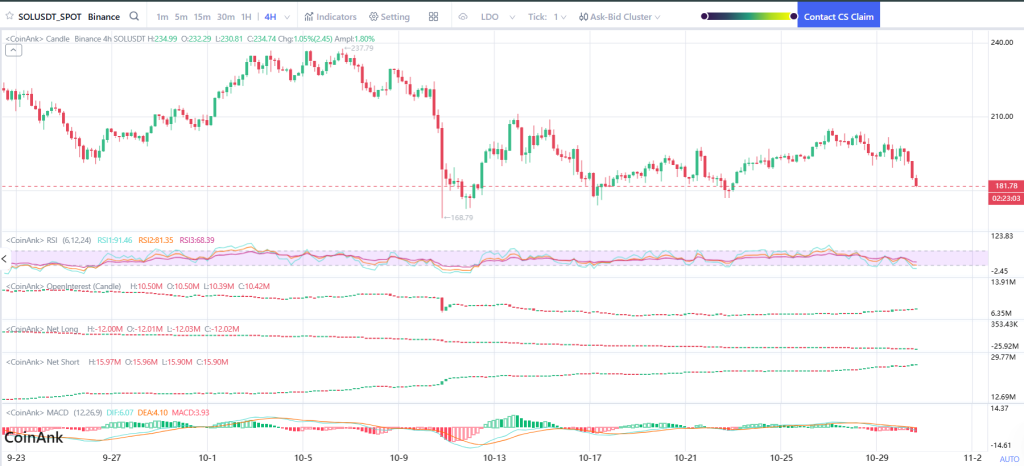
The 4H chart shows SOL price slowly bleeding lower after failing to break above $240 for the second time this month. Sellers stepped in aggressively at that level, and the latest drop now pushes price directly onto the $180–$185 support band.
That is the same zone where buyers defended strongly during mid-October. The trend is still overall bullish on higher timeframes, but this short-term structure could slip into a lower-high pattern if support fails here. This makes the current level a critical pivot for November.
Market Indicators
RSI saw a sharp drop from overbought territory and now sits much closer to a neutral range. That means the market has reset from the prior rally and may have room to bounce.
MACD has turned red again, signaling slowing momentum, but it has not shown a full bearish divergence breakdown.
Open interest dipped slightly on the recent correction, though liquidity remains high, which suggests traders have not abandoned their positions.
Net short positioning has grown during this drop, which could actually help fuel a sharp rebound if SOL price stabilizes and squeezes shorts back upward.
Read Also: On-Chain Data Shows Why ONDO Price Could 2X Next
Solana Price Short-Term Outlook for November
November likely depends on how SOL behaves here at support. If buyers defend the $180 region as they did last month, the price could reset and make another attempt at $230–$240.
A clean break through that resistance range would mark trend continuation and potentially open the door toward the $260–$280 zone later in the month.
But if $180 breaks with volume, momentum turns bearish, and a deeper pullback into the $165–$170 region becomes likely for SOL price before any recovery attempt.
Despite macro fears, the ETF launch and growing stablecoin utility remain strong tailwinds for Solana. The chart is not broken – it’s simply testing a crucial level.
Hold the line at $180, and confidence can quickly return. Lose that level, and buyers may step back until conditions improve.
Right now, the market watches this support zone closely. The next move from here sets the tone for the entire month ahead.
Subscribe to our YouTube channel for daily crypto updates, market insights, and expert analysis.