
PI Network officially launched its token on exchanges in February this year, and the excitement was massive. PI coin opened strong, reaching around $3.0 at its all-time high in the same month.
After that quick rally, things started to turn south. The token has since been trapped in a persistent downtrend, losing over 90% of its value. PI price is now hovering near $0.2, sparking curiosity about whether the market is finally ready for a reversal or just pausing before another dip
What you'll learn 👉
PI Bulls Keep Defending the $0.20 Support
PI coin has shown some signs of resilience on the hourly chart. The price slipped by roughly 1% recently, yet buyers quickly stepped in around the $0.20 zone. That level has become a key zone. The same support triggered a 5% intraday bounce on October 21, suggesting that bulls are qui accumulating in this range.
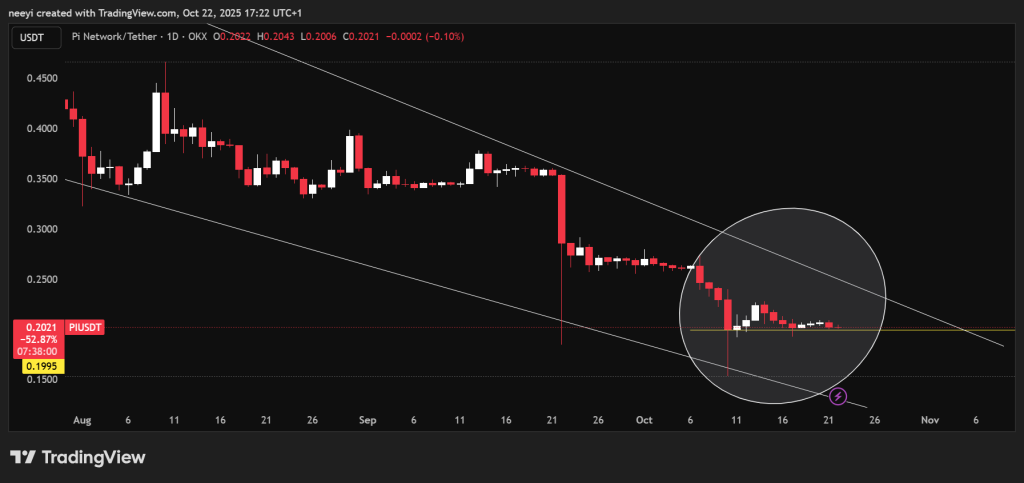
This accumulation hints at improving sentiment around the token. The technical structure looks healthier as liquidity flow increases, signaling more participants stepping back in. Sustaining this bounce will depend heavily on how long the $0.20 base can hold and whether momentum buyers can continue to support it.
What Technical Indicators Suggest for PI Token
We checked Investing. com to see where the price might go next, and the daily chart indicators reveal how market momentum is shaping up.
| Name | Value | Action |
| RSI(14) | 29.543 | Price is in oversold territory, showing selling pressure remains dominant but a rebound could follow if demand increases |
| STOCH(9,6) | 40.855 | Momentum remains weak, reflecting limited buying strength despite minor upward moves |
| MACD(12,26) | -0.024 | Trend remains bearish, signaling downward continuation unless a breakout shifts sentiment |
| ATR(14) | 0.018 | Market is showing lower volatility, hinting at consolidation before a possible big move |
| Ultimate Oscillator | 49.534 | Price action is balanced between buyers and sellers, showing indecision in the market |
RSI at 29.543 points to an oversold condition, showing that sellers have been in control for quite some time. Such readings often precede a short-term rebound if demand starts to return.
STOCH at 40.855 also leans bearish, suggesting momentum remains weak despite a few green candles on shorter time frames.
MACD showing -0.024 confirms the negative sentiment, indicating the trend is still downward and the bulls haven’t reclaimed control yet.
ATR at 0.018 signals lower volatility, which could mean the market is consolidating before its next move either a breakout or another leg down.
The Ultimate Oscillator hovering near 49.534 shows balance between buyers and sellers. This neutrality could turn into an advantage if price breaks above key resistance levels.
Current PI Price Outlook and What the Chart Shows
The chart shows PI price has been in a clear descending channel pattern since mid-May. PI coin now trades around $0.20 after a long drop following its February surge. The hype faded quickly.Concerns about the project’s fundamentals and network issues hurt market confidence.
Multiple supports were broken over the months. This wedge has been tightening recently, which often signals an approaching breakout.
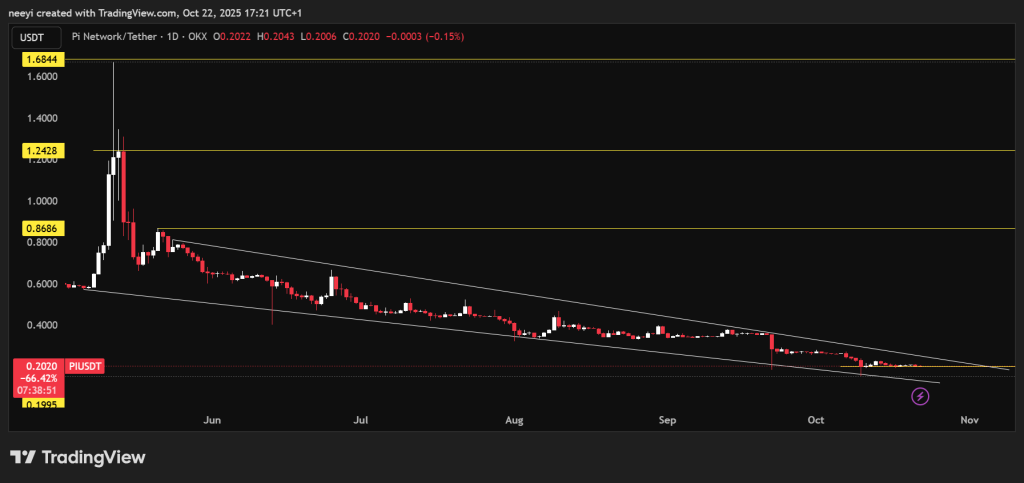
For a real shift to the upside, price needs to break above the wedge resistance line. Historically, such breakouts can lead to significant rallies as traders look for a reversal confirmation. In PI’s case, a successful breakout could trigger a rally of roughly 300%, pushing the price toward $0.86. If bullish momentum builds, the $1 area could become the next target zone
Read Also: Here’s When Polkadot (DOT) Price Could Finally Flip Bullish Again
The downside risk remains around $0.19, which has acted as strong support since the October 10 sell-off. Maintaining this level is crucial. A clean break below it could open the door to deeper losses for PI price making recovery harder in the near term.
Subscribe to our YouTube channel for daily crypto updates, market insights, and expert analysis.