
Crypto analyst Max Crypto, who has over 111,000 followers on X, has once again caught the community’s attention with a new Bitcoin chart that hints at something big. His analysis indicates that Bitcoin might be entering another correction phase – one that looks eerily similar to past pullbacks on the same long-term trendline.
What you'll learn 👉
What Bitcoin Chart Reveals
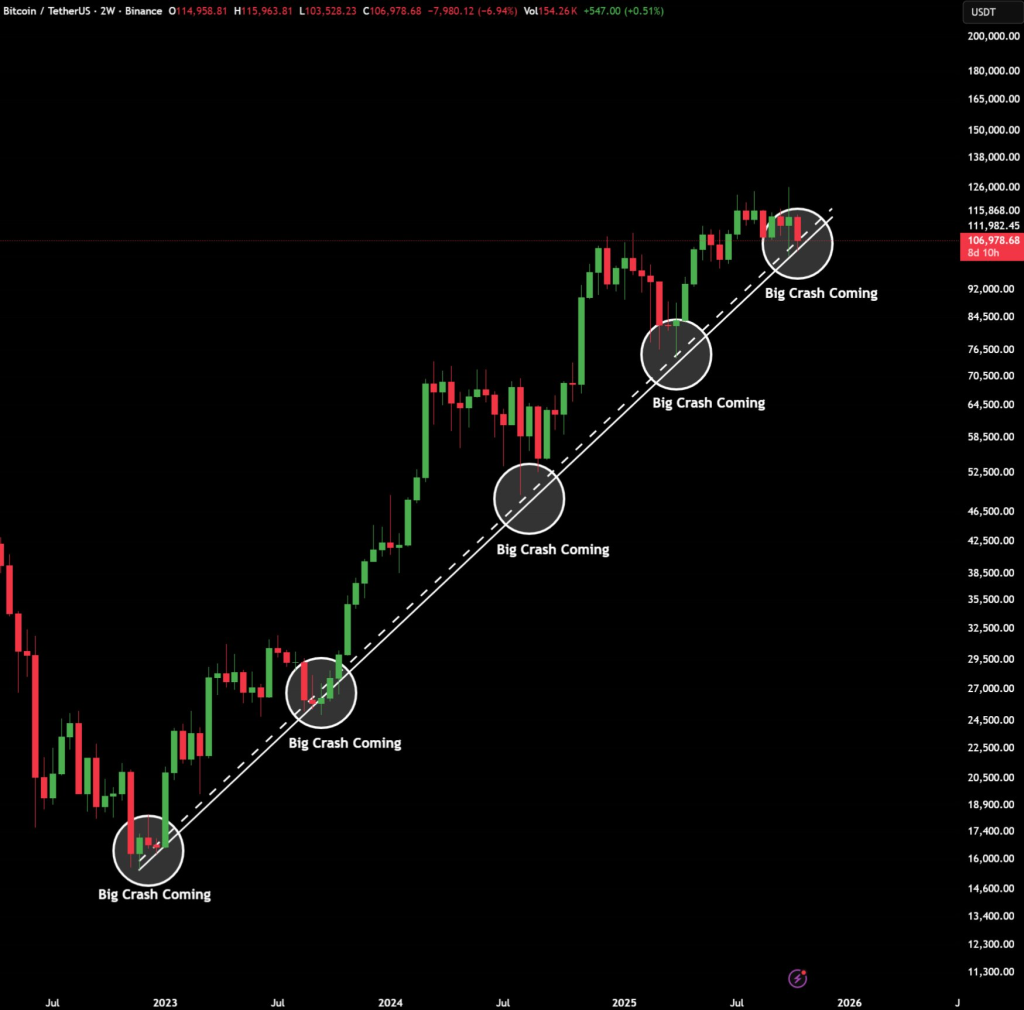
The chart covers Bitcoin’s two-week candles from mid-2022 through late 2025. It highlights a steady ascending trendline, connecting every major low of the past three years.
Each time Bitcoin touched or slightly dipped under this line, a noticeable selloff followed. Max labeled each of those moments “Big Crash Coming,” noting that similar setups have often been followed by temporary but sharp drops.
Here’s how those past moves played out:
- Late 2022: Bitcoin broke below $20,000 and fell toward $15,500 before rebounding.
- Mid-2023: BTC dropped from around $32,000 to $25,000 – roughly a 20% correction.
- Mid-2024: Another dip came after Bitcoin hit $73,000, retracing to around $56,000.
- Now (late 2025): Bitcoin trades near $107,000–$112,000, again sitting right on that same rising trendline.
This pattern indicates that Bitcoin might face another short-term pullback, possibly toward the $90,000–$95,000 range if the trend repeats.
As Max put it in his post:
“Big crash coming” for $BTC. Just like in the past, bears will be right again.
Still, it’s worth noting that every one of these “crashes” in the past eventually turned into a launchpad for new highs.
Bitcoin Dominance and Altcoin Season
Despite the cautious tone, Bitcoin remains the dominant force in the market. Its dominance is sitting at 58.75%, slightly down from 56.91% last month but still high enough to show where investor confidence lies.
Meanwhile, the CMC Altcoin Season Index has crashed from 77/100 to just 23/100, flipping the market from Altcoin Season to Bitcoin Season. That shift tells a clear story – traders are moving out of volatile altcoins and parking funds back into BTC for safety.
It’s classic behavior during periods of uncertainty.
Read also: Best Crypto to Buy During Bitcoin’s Dip as Altcoin Interest Cools Off
Fear and Greed Index: Still in Fear Territory
The Crypto Fear and Greed Index sits at 25/100, signaling strong fear across the market. In practice, this means traders are cautious, less willing to hold riskier positions, and more likely to take profits early.
But historically, this level has often marked accumulation zones – when whales and long-term holders quietly reload while retail sentiment turns pessimistic.
If Max’s trendline analysis holds true, a short-term correction could definitely be on the table. But every time this setup appeared before, Bitcoin eventually bounced back stronger – setting new highs after the shakeout.
The $100,000 mark now stands as a crucial psychological and technical level. Holding above it keeps the broader bull trend alive, while a break below could trigger the kind of correction Max is warning about.
So yes – a pullback might be coming. But if history is any guide, it’s not the end of the run… just another chapter in Bitcoin’s long, volatile, and surprisingly predictable story.
Subscribe to our YouTube channel for daily crypto updates, market insights, and expert analysis.