Kaspa community analyst S𐤊i ₿um Trading shared a weekly chart of KAS with the Relative Volatility Index (RVI) that he uses to call peaks and bottoms. His takeaway: the RVI is sitting in its buy zone again and the bottom may be in.
The chart plots KAS/USD on a weekly timeframe with the RVI(10) beneath it. You can see three clear regimes on the RVI: a lower band near the 20–35 area (bottoming zone), a mid band around 40–60 (neutral), and an upper band near 70–80 (topping zone). Vertical guide lines make it easy to match RVI extremes with price turns. Each time the RVI spiked into the upper band, KAS soon printed a local high. When the RVI sank into the lower band and curled up, KAS began a new advance.
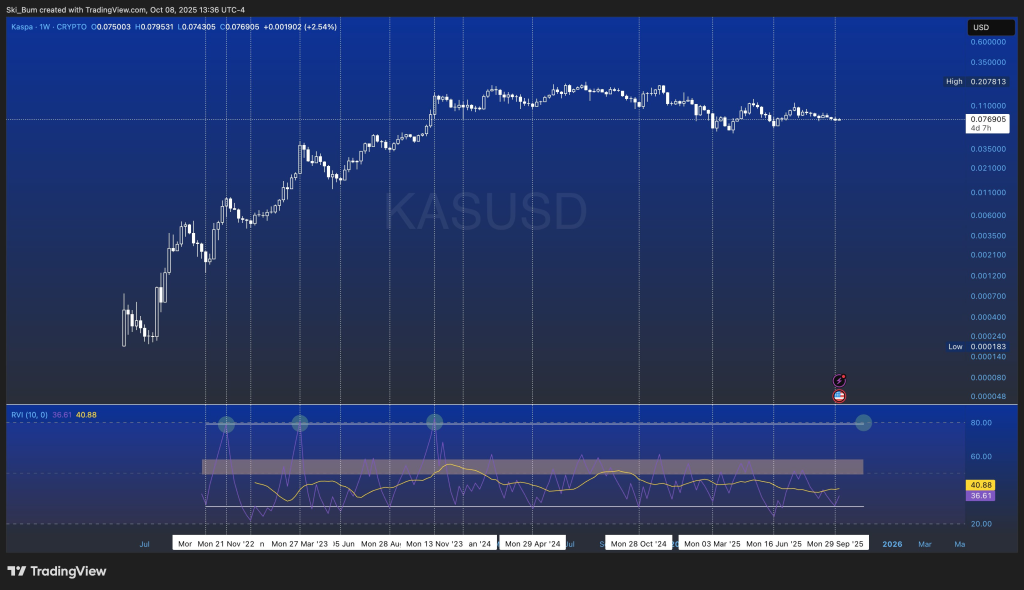
Right now the RVI line sits in the lower third (roughly mid-30s) with the signal line just above it around 41. That positioning – low, flat, and close to crossing up – has preceded upside rotations several times on this chart. Price action supports that read: The Kaspa price has held a multi-month base between roughly $0.07 and $0.08 after a long consolidation from the $0.20 high. Sideways candles with shrinking volatility fit a late-stage bottoming process the RVI is designed to capture.
How to turn this into a plan:
- What would confirm the bottom: a weekly RVI cross back above its signal and a push through the neutral band toward 50, paired with a weekly close back above the range mid near $0.085–$0.09.
- First hurdles for price: the range ceiling around $0.10–$0.11. Clear that, and the path opens to $0.13–$0.15, then a potential retest of the $0.20 all-time high.
- Invalidation: a fresh RVI low into the 20s and a weekly close below the base (~$0.07) would delay the bottom call and keep KAS in chop.
A quick word of caution: RVI has worked well on this chart, but no indicator is perfect. Sample sizes on crypto weekly data are small, and exogenous news can overwhelm technicals. Use it as a timing tool alongside levels, volume, and broader market trend.
Bottom line: the weekly RVI is back in its historical buy zone and starting to turn. If the KAS price holds the $0.07–$0.08 base and the RVI crosses up, the next leg toward the top of the range looks likely.
Read also: The Real Reasons Crypto Exchanges Are Suspending Kaspa Withdrawals
Subscribe to our YouTube channel for daily crypto updates, market insights, and expert analysis.