
Binance Coin rally is turning into one of the biggest stories of this cycle. The coin that everyone counted out earlier in the year is now leading the entire market, and it’s not slowing down.
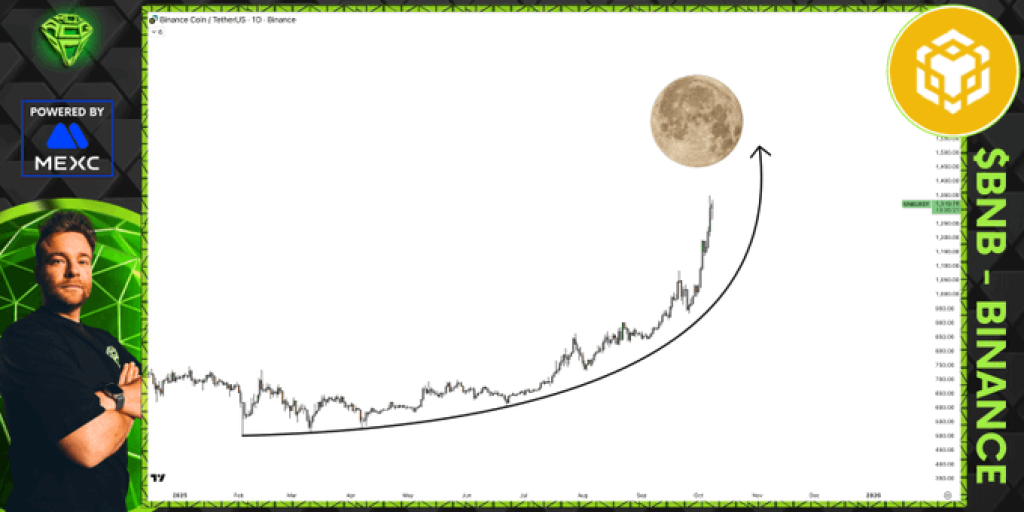
Right now, BNB price is trading around $1,300, having exploded over the past few weeks in what analyst Sjuul from AltCryptoGems calls a “parabolic moon mission.” The move has been so sharp that it’s taken even veteran traders by surprise.
But according to Sjuul’s latest charts, this might just be the middle of the journey, not the end.
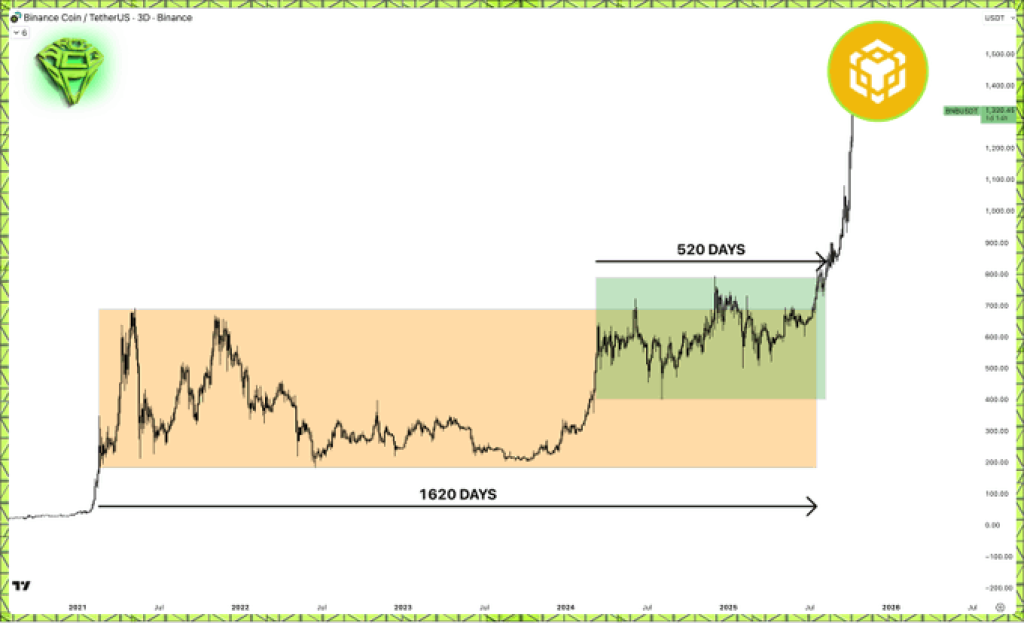
As Sjuul explains, BNB’s monster rally isn’t random. It’s the direct result of two major consolidation phases that built up energy for years.
The first accumulation range lasted roughly 1,620 days, stretching back to the early stages of BNB’s market history. The second, much shorter but equally significant, lasted 520 days. Both periods formed massive bases that have now broken to the upside.
When you have consolidations that long, the breakout that follows tends to be explosive. It’s simple market physics: the longer the pressure builds, the bigger the expansion once the lid finally comes off.
What you'll learn 👉
Binance Coin Enters Price Discovery Mode
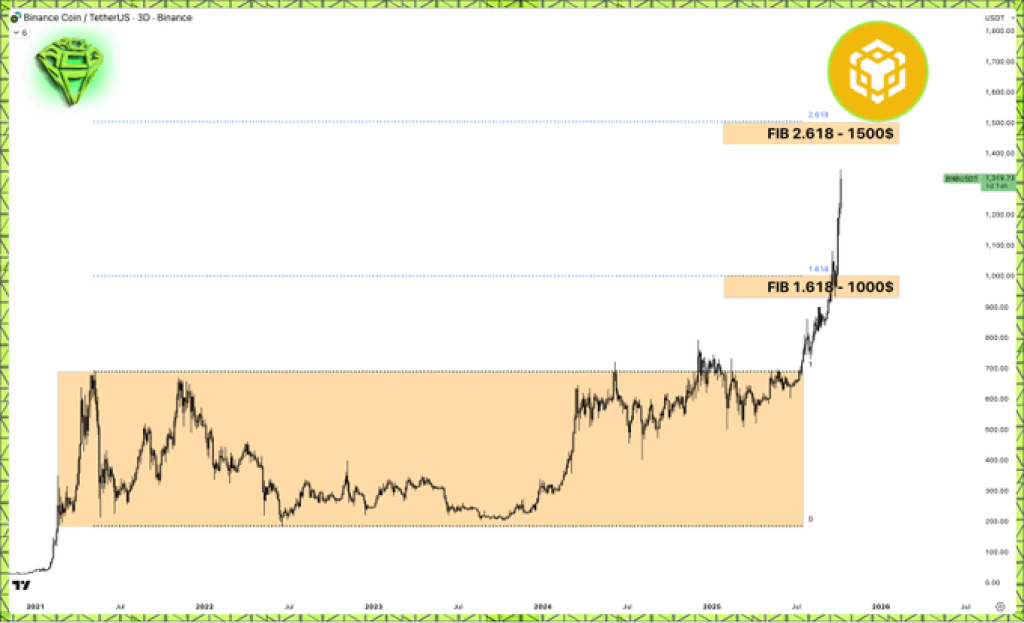
Now that BNB price has cleared its old all-time highs, it’s officially in price discovery, the most exciting (and unpredictable) phase of any bull run.
With no historical resistance above, the only way to project potential targets is through Fibonacci extensions. Using the longer consolidation as the base, Sjuul highlights the FIB 2.618 level at $1,500 as the next logical resistance.
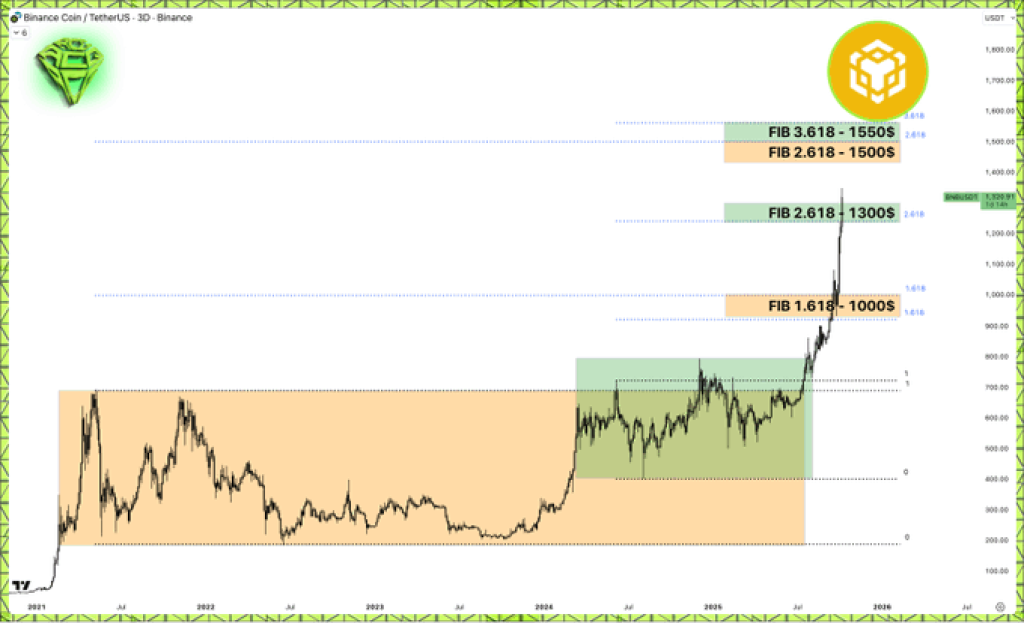
Interestingly, if we apply the same Fibonacci tool to the shorter, 520-day consolidation, the chart still gives us a target near $1,550, this time aligning with the FIB 3.618 level. When multiple Fibonacci projections converge like that, it often strengthens the probability of that zone becoming a magnet for price.
In short, both setups point toward the same thing: BNB price next big milestone could be around $1,500–$1,550.
Read Also: Litecoin (LTC) Faces Major Test: Why Another Crash to $50 Is Possible
Where the Next Buying Opportunity Could Appear
But here’s where things get even more interesting. While the structure looks incredibly bullish, Sjuul cautions against chasing green candles. After a run this steep, corrections are normal and often healthy.
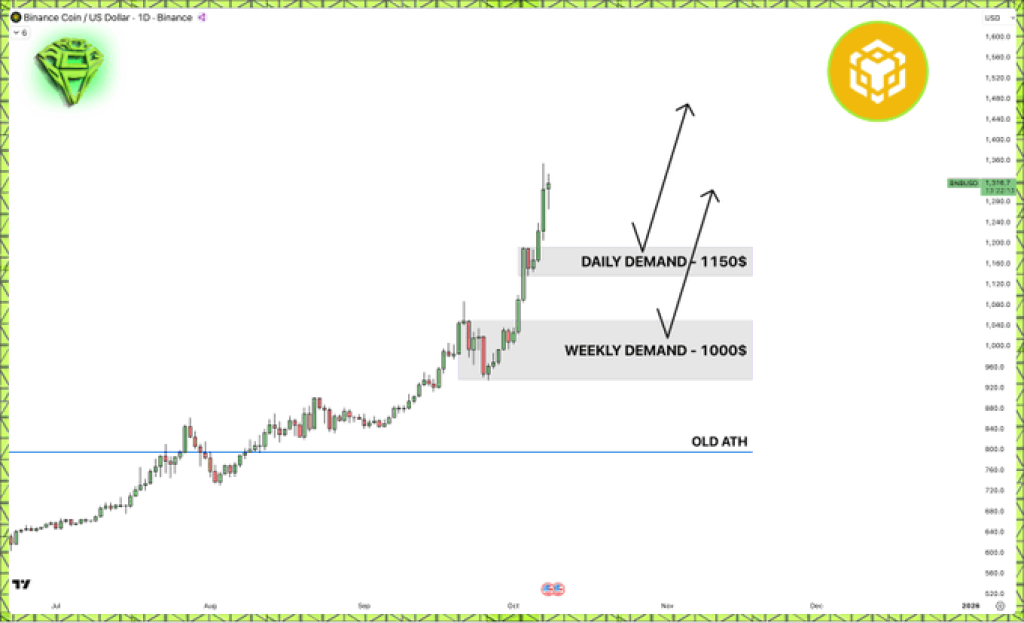
The charts show two strong demand zones below the current price action. The first sits around $1,150 (daily demand), while the second, and stronger area, is near $1,000 (weekly demand).
These zones act as magnets for potential pullbacks and are the most likely areas where new entries could set up. For traders who missed the move, this is where patience pays off, especially when using a dollar-cost averaging (DCA) strategy.
What Makes This Rally So Different
BNB’s move stands out because it’s happening despite the broader market still hesitating. Many altcoins are consolidating, yet BNB price continues to carve higher highs.
The rally also carries a psychological angle. As Sjuul points out, this might be “one of the most hated rallies of the cycle.” Many traders dismissed BNB months ago due to regulatory pressure and FUD around Binance, but those who stayed focused on the charts are now being rewarded.
BNB technical structure suggests this run isn’t done yet. The $1,500–$1,550 range looks like the next logical destination, but don’t expect a straight line. Healthy dips toward $1,150 or $1,000 could create new opportunities before the next leg higher.
Either way, this is a defining moment for Binance Coin price. It’s not just another pump; it’s a breakout that’s been 1,600 days in the making. And if history is any guide, that kind of buildup doesn’t end quietly.
Subscribe to our YouTube channel for daily crypto updates, market insights, and expert analysis.