
Pudgy Penguins price has been consolidating between $0.046 and $0.026 since mid August, drawing a clear channel that traders could keep watching.
An analyst on X named Ali pointed out that PENGU price is bouncing off channel bottom and seems to be eyeing $0.044 as a next target. That observation turns a chart into a question many traders could want answered: could this move turn into a full 2x run for PENGU price?
Ali’s read starts with a classic setup. Price found support near $0.026 and then formed a low from which a bounce started. That kind of bounce matters because it gives a clear place to define risk and a clear place to define a bullish target.
Ali sees the bounce as a first push toward the top of the channel near $0.044. A push like that would be meaningful for PENGU even if it stops short of a full double.
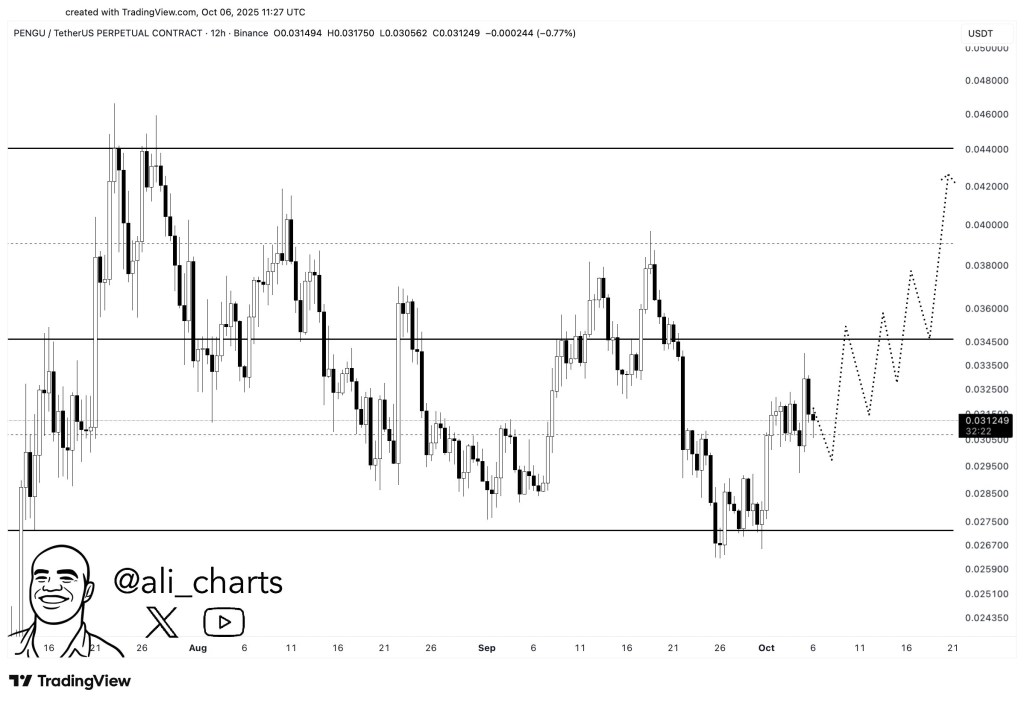
Looking at Ali’s chart shows a labeled channel and a dotted path rising toward $0.044. Candles that bounced off the lower boundary show a clear reaction from buyers. A climb toward the midpoint of the channel would likely find short term resistance near about $0.034, which may cause choppy price action.
If that level clears, the path to $0.044 becomes more plausible. Ali’s scenario relies on momentum holding through two or three stops rather than a single sprint. That staged climb matches the dotted pattern on the chart, which sketches a slow stair step toward resistance rather than a straight arrow up.
Technical Indicators and What They Mean for PENGU Price
The technical indicator for PENGU listed on investing.com on the daily chart have a “Strong Buy” reading: Buy: 8, Neutral: 2, Sell: 0. Below is the table of the indicators and an explanation of what each value is showing right now.
| Name | Value | Action |
| RSI(14) | 52.751 | Shows balanced momentum sitting just above 50, suggesting no clear dominance by buyers or sellers |
| STOCH(9,6) | 70.496 | Points to bullish momentum with stochastic near the upper band but not extreme |
| STOCHRSI(14) | 93.365 | Signals overbought conditions on a short timeframe and warns of a possible short pause or pullback |
| MACD(12,26) | 0 | Indicates a neutral center with signs that a bullish crossover is present or forming |
| Williams %R | -21.452 | Reflects strength with price trading close to recent highs on its timeframe |
| Ultimate Oscillator | 57.779 | Suggests buying pressure across multiple timeframes and supports a bullish tilt |
| ROC | 10.341 | Confirms positive rate of change showing upward momentum over the measured period |
What the Indicators and Chart Together Tell Us About a Potential 2x for PENGU
Chart structure plus indicators paint a cautious bullish picture. Ali’s channel read and the investing.com summary lean toward a move up rather than a collapse right now. A quick note about math: a 2x from roughly $0.03 would land near $0.06, which sits well above Ali’s $0.044 target.
That means a run to $0.044 would be a strong rally but still short of a full double from current mid $0.03 levels. StochRSI being overbought flags that any rally could pause along the way. Momentum shown by ROC and Ultimate Oscillator supports upside, while RSI near 52 suggests room to run but not runaway strength.
Read Also: Elite Crypto Analyst Predicts SUI Price Could Hit $7 as Accumulation Ends
A clear path exists for a move up toward $0.044 if buyers keep stepping in where Ali marked support. Reaching $0.044 would be bullish and would confirm the channel bounce idea. Achieving a full 2x from present mid $0.03 prices requires continued strength beyond that point and clean breaks of a few resistance levels along the way.
Subscribe to our YouTube channel for daily crypto updates, market insights, and expert analysis.