Analyst Ali Martinez says the accumulation phase for SUI “looks nearly complete” and calls this the zone to load up before a move to $7. His new chart lays out a clean bullish roadmap.
On the daily SUI/USDT perpetual chart, price is riding a rising trendline that has been building since spring. Higher lows press into a flat supply band around $4.05–$4.20. That’s a classic ascending-triangle look. The level also lines up with the 0.786 Fib at $4.207 on the chart, which adds weight to it.
SUI trades near $3.6 on the snapshot. That sits just above the 0.618 Fib pivot at $3.473. Buyers have defended this area several times. Martinez maps a dotted path that shows one more small dip to the trendline, a break and daily close over ~$4.20, and then a stair-step run into targets.
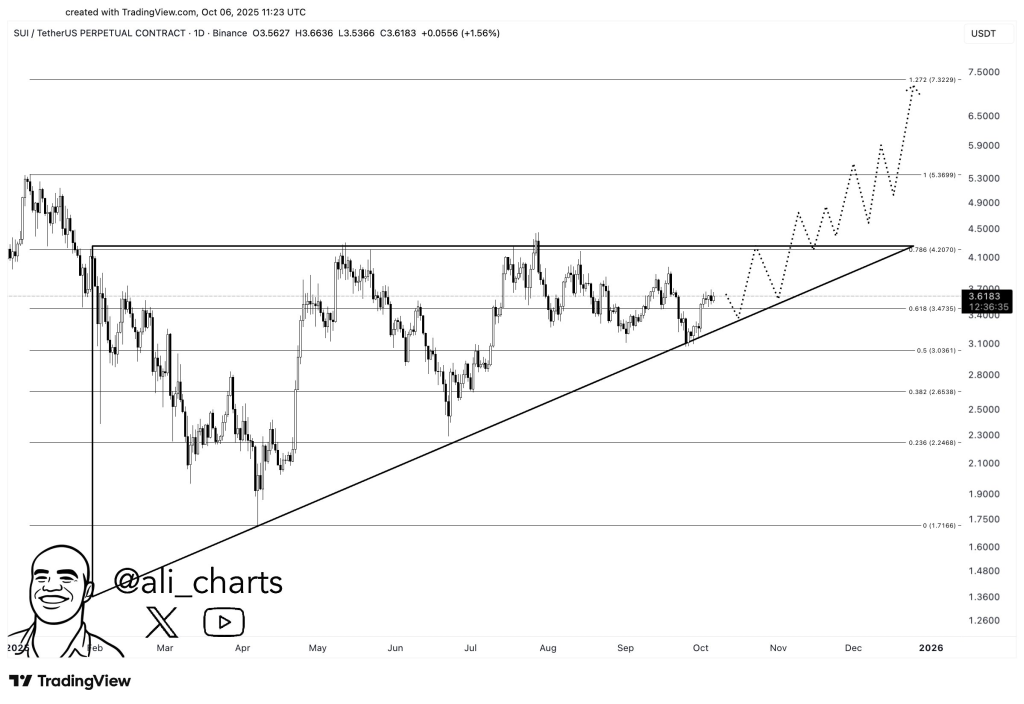
Those targets are clear on the graphic:
- First leg to the $4.90–$5.30 zone, matching the 1.0 Fib extension (~$5.37).
- Continuation into $6.0–$6.2 on momentum.
- Final objective near $7.32 at the 1.272 extension.
The idea is simple: hold the higher-low structure, crack $4.20 with volume, then follow through toward the extensions.
What could go wrong? Losing the rising trendline and the $3.47 pivot would cool the setup. Below that, supports sit at $3.06 (0.5 Fib), $2.65 (0.382), and $2.25 (0.236). A daily close under $3.06 would weaken the bullish case and push the pattern back into range mode.
My read: the chart earns a bullish bias as long as SUI keeps printing higher lows above $3.47. The trigger is a clean breakout and close over $4.20. If that happens, the $5.3 and $7.3 magnets come into play. If not, expect more grind along the trendline until the market chooses a direction.
Read also: Solana, Dogecoin, Sui Among $773M in Major Token Unlocks Hitting the Market
Subscribe to our YouTube channel for daily crypto updates, market insights, and expert analysis.