Popular crypto influencer Carl Moon, who has over 1.5 million followers on X, just shared a viral ADA chart. Even though the ADA price is still trading below $1, Carl predicts it can hit $5 in this cycle.
What you'll learn 👉
What the ADA Chart Shows
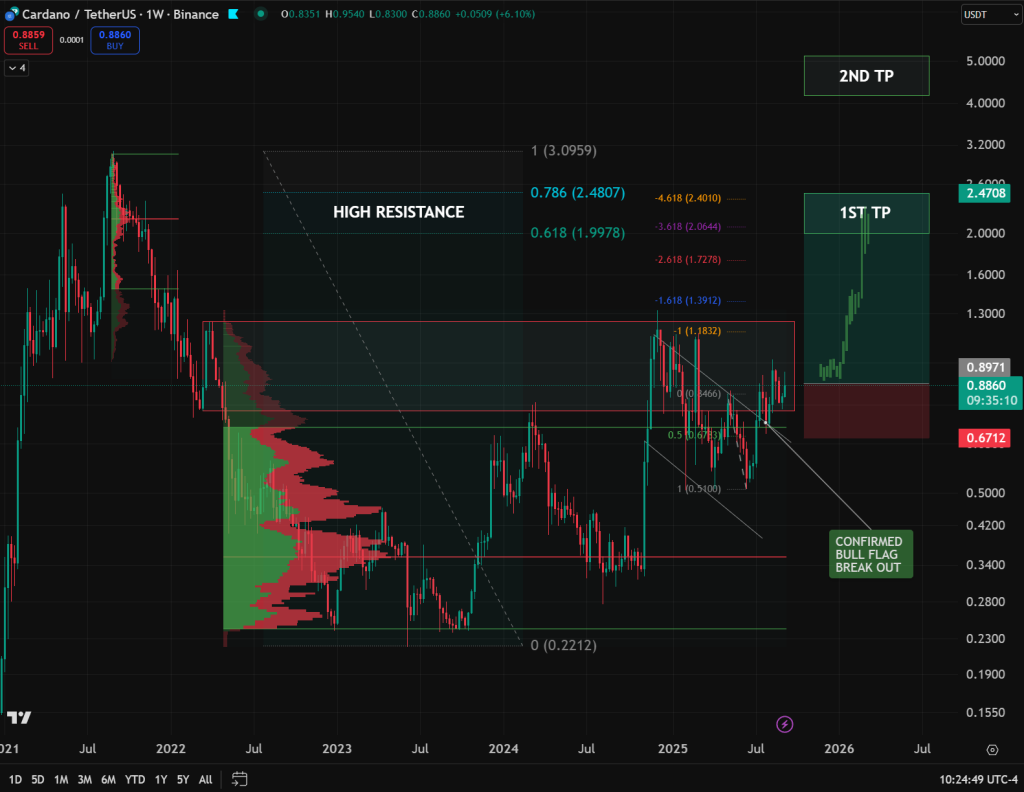
On the weekly chart ADA is breaking out of a clean bull flag pattern. The breakout is confirmed with price now holding around $0.88–$0.90 after pushing past the flag’s upper trendline. This pattern often marks the end of a long consolidation and the start of a stronger move up.
Moon highlights key Fibonacci retracement levels from the 2021 all-time high near $3.10 down to the 2022 low at $0.22. The first major Fibonacci target sits at the 0.618 level around $1.99, while the 0.786 level near $2.48 is next. Above those, the chart marks a larger resistance band between roughly $1.18 and $1.39. Moon says a weekly close above $1.39 will open “clear skies” for a rally toward $5.
ADA Price: Resistance and Support Zones
The price has strong support near $0.67, which lines up with previous volume clusters on the chart. Immediate resistance is the $1.18–$1.39 zone. Clearing that area is critical because it held back ADA during several rallies in 2022 and 2023. A sustained close above $1.39 would shift the market structure and signal a higher-timeframe uptrend.
The first target after that breakout is around $2.00–$2.48, matching the key Fibonacci levels. The second target Carl marks is $5.00, which sits just above the 4.618 Fibonacci extension.
ADA has traded between $0.25 and $0.90 for most of the last two years. The breakout from the bull flag suggests growing momentum, with weekly closes now pressing against resistance. If buying volume continues and Bitcoin holds its own bull trend, ADA could test $1.20 and then $1.40 in the next few months. After that, the Fibonacci map gives $2.00 and $2.48 as logical milestones before a possible run to $5.
Can ADA Really Hit $5 by End-2025?
Reaching $5 would mean more than a five-fold gain from current prices. In the 2021 bull run ADA climbed from $0.10 to over $3 in less than a year, so a similar move is not impossible in a strong market. Still, it would require broad crypto market strength, steady Cardano ecosystem growth, which was not the case in recent years by the way, and no major macro shocks.
For now the technical picture is bullish. The bull flag breakout is confirmed and key resistance levels are well defined. A weekly close above $1.39 is the next signal traders are watching. If that happens, Carl Moon’s roadmap of $2.48 first and $5 later in the cycle remains on the table.
Subscribe to our YouTube channel for daily crypto updates, market insights, and expert analysis.