Mantle ($MNT) has exploded higher this week, climbing more than 35% and drawing attention across the crypto market. The rally comes as the coin broke out of a broad trading channel that has capped price since early 2025.
On the weekly chart shared by analyst Ali Martinez, Mantle has cleared a major resistance band around $1.35–$1.45. That area acted as a ceiling several times over the past year. By closing above it, MNT has flipped a long-term supply zone into support and opened the door for the next leg higher. Martinez’s chart shows a dotted path that projects a possible rise toward $3.60 if momentum continues.
What you'll learn 👉
Chart Structure and Key Levels
The breakout is easy to spot on the weekly timeframe. After months of sideways trading between roughly $0.60 and $1.30, Mantle surged through its old upper limit with strong candles and higher volume. The move above $1.45 is significant because it breaks a year-long pattern of lower highs and weekly failures at that level.
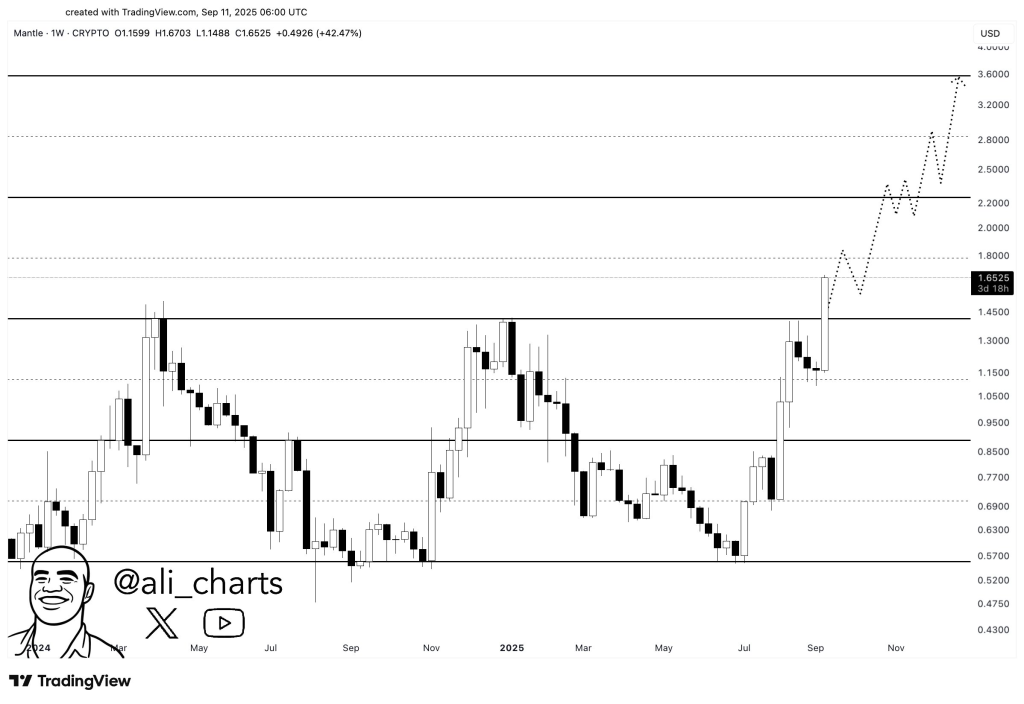
The next levels to watch are equally clear. Martinez identifies $1.80 as the first upside checkpoint where price may pause to consolidate. Above that, Mantle could target $2.20 and $2.80, with the chart’s larger measured move pointing to a final zone near $3.60. Those marks line up with historical pivots and Fibonacci extension levels, giving technical traders clear reference points for the weeks ahead.
Support has shifted higher as well. The old resistance at $1.35–$1.45 now acts as the primary floor. If Mantle can hold weekly closes above this band, the breakout remains valid and the trend higher stays intact. Beneath it, there is secondary support around $1.20–$1.15, an area of previous weekly consolidation.
Why the Price Moved
The speed of this week’s rally reflects more than a one-off news bump. After months of compression, Mantle’s chart was primed for a larger move once buyers gained control. The breakout triggered momentum traders and stop orders, creating a surge of follow-through buying. The large-bodied candles and volume spikes that followed are a classic sign that the market is re-pricing the asset and starting a new trend.
Market sentiment also shifted as the breakout confirmed. As Martinez points out, breaking a major weekly structure often draws in fresh capital from swing traders and longer-term investors who had been waiting for proof that the downtrend was over.
Short-Term Outlook
Looking ahead, Mantle’s immediate test is whether it can hold the $1.45 zone as support on weekly closes. A brief pullback to retest this area would be normal and even healthy. If buyers defend it and push back toward the highs, the next likely move is a climb toward $1.80–$1.90, followed by a shot at $2.20.
If momentum and volume stay strong, Mantle could then stretch toward $2.60–$2.80, and eventually the long-term projection around $3.20–$3.60 that Martinez outlines. A weekly close back below $1.35, on the other hand, would signal that the breakout has failed and could send price back to the $1.15–$0.95 region.
Subscribe to our YouTube channel for daily crypto updates, market insights, and expert analysis.