Kaspa price has been stuck inside a tight range for the past 2 months. Since July, KAS traded within a triangle pattern that kept pressing the token against heavy resistance. That stretch tested patience, but now the breakout looks clear. Kaspa price has moved above that ceiling, opening the door for a possible rally.
The mid-term target sits around $0.119. If momentum holds, this breakout could translate into gains of nearly 50%. The structure has been building, and now the reaction is starting to show.
What you'll learn 👉
What Kaspa Chart Is Showing
The breakout on the Kaspa price chart is important. Triangles are continuation patterns, and once resistance gives way, the path higher often comes quickly.
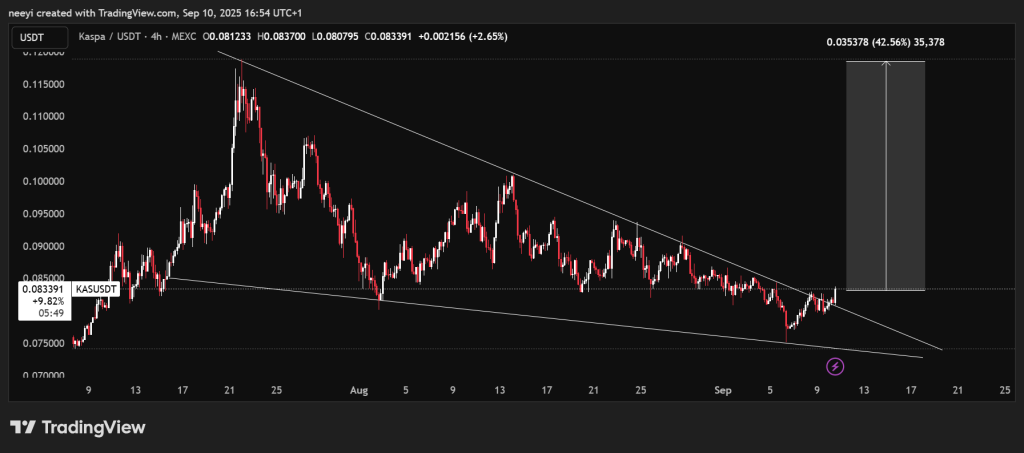
In this case, the breakout above the 2-month resistance line suggests buyers are regaining control. The candles are also printing higher lows, which confirms that demand has been steadily building.
Momentum appears to be shifting. As long as KAS price stays above the broken resistance level, the upside scenario toward $0.119 remains active. That level could be the next big checkpoint for traders watching this move unfold.
Kaspa Price Indicators Show Momentum Building
We checked the indicator readings on the 5-hour chart through Investing.com. Here is what the numbers currently show:
| Indicator | Value | Interpretation |
|---|---|---|
| RSI (14) | 66.572 | The Relative Strength Index is approaching overbought territory, but still signals strong buying pressure rather than exhaustion. |
| STOCH (9,6) | 51.1 | Stochastic sits near the middle, showing neutral momentum. It means the market has room to lean either way depending on short-term sentiment. |
| MACD (12,26) | 0 | The Moving Average Convergence Divergence has crossed into positive territory, suggesting bullish momentum is gaining ground. |
| Highs/Lows (14) | 0.001 | This reading points to upward momentum, supporting the view that buyers are in control. |
Taken together, the indicators lean bullish. RSI is not yet overheated, MACD has turned positive, and the highs/lows point to strength. The only hesitation comes from the Stochastic being neutral, but that simply reflects consolidation before a bigger push.
What This Means for Kaspa Price
Kaspa looks ready for its next move. The breakout from a 2-month triangle pattern is a clear technical signal. Indicators on the 5-hour chart back that up, with more buying pressure than selling signs. If KAS holds above its former resistance, the rally toward $0.119 could play out in the near term.
Read Also: Here’s Shiba Inu (SHIB) Price If Ethereum Reaches $10,000
Momentum has shifted for KAS, and the chart is giving a fresh signal. These setups can move quickly once the market decides on direction.
Subscribe to our YouTube channel for daily crypto updates, market insights, and expert analysis.