Markets love moments of breakout, and Raydium price just had one. After days of consolidating in a tight range, RAY token finally pushed through a major resistance level. For traders like Ali, this is the kind of setup that often sparks a quick rally.
The chart shared by Ali on X shows a clean symmetrical triangle pattern forming since mid-August. Price action squeezed tighter as highs kept dropping and lows kept rising, building pressure like a spring ready to snap. Earlier today, RAY token finally broke upward, signaling the end of the consolidation phase.
This breakout did not happen in isolation. It aligns neatly with Fibonacci retracement levels, adding weight to the move. The push above $3.50 marked a break beyond the 0.618 retracement level, often considered a critical turning point in trend continuation.
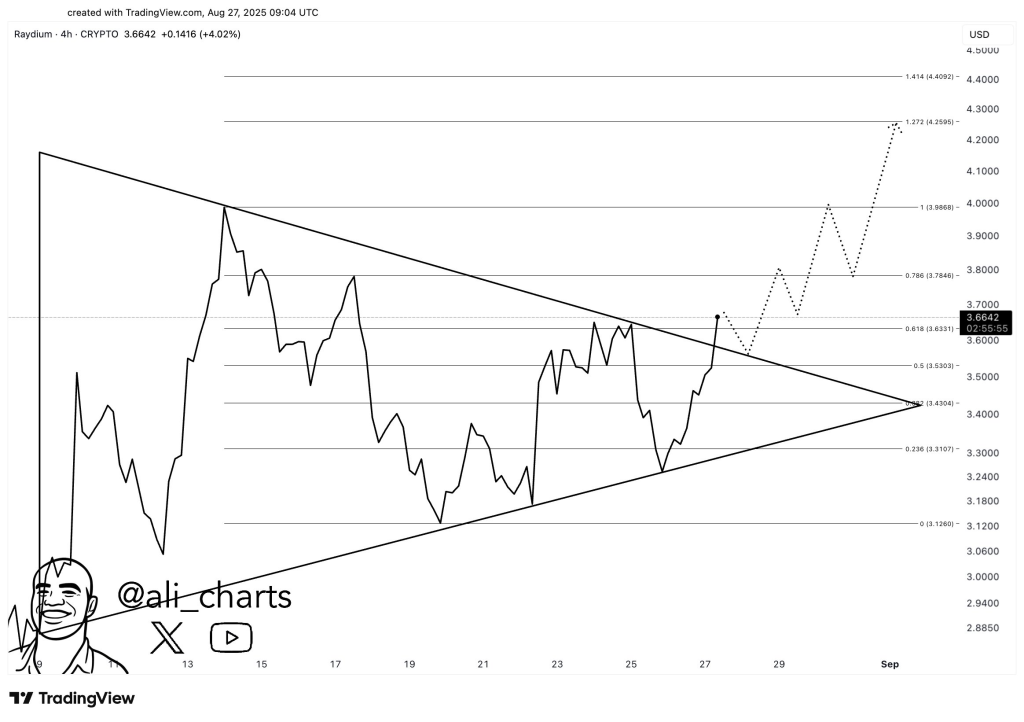
If the breakout holds, Raydium price has a natural path toward $3.88, which is where the 1.0 retracement sits. From there, continuation could stretch toward $4.20 at the 1.272 extension and possibly $4.50 at the 1.414 extension. Each level acts like a rung on a ladder, creating short-term checkpoints for traders watching the rally.
What Technical Indicators Say About RAY Price
Chart patterns often need confirmation from indicators, and here the signals lean slightly bullish. We checked investing .com for the technical indicators of Ray Price. The snapshot below highlights how Raydium token looks on common tools:
| Indicator | Value | What It Suggests |
| RSI (14) | 56.915 | Momentum leans toward buyers |
| MACD (12,26) | 0.109 | Bullish crossover supports upside |
| ADX (14) | 29.28 | Trend strength is moderate but improving |
| ATR (14) | 0.3306 | Price showing lower volatility |
| Ultimate Oscillator | 47.634 | Bears hold a slight edge |
| ROC | -4.8 | Some selling pressure remains |
| Bull/Bear Power (13) | 0.261 | Buyers still have control |
The table shows more indicators supporting a bullish short-term move than not. While ROC and the Ultimate Oscillator point to hesitation, RSI, MACD, and ADX lean toward strength. This combination paints a picture of cautious optimism.
Raydium token has broken free from its triangle pattern, and technical levels now suggest possible upside toward $4 and beyond. Fibonacci targets align well with momentum indicators, making this breakout one to watch.
Read Also: XRP Rich List Might Surprise You – How Much Do You Need to Be in the Top Holders?
Markets rarely move in straight lines, so pullbacks could happen. What matters most is whether RAY price holds above the $3.50 breakout zone. If it does, the path toward higher levels remains wide open.
Is this the early spark of a bigger rally or just a short burst before cooling off? That’s the question traders will be watching closely as August turns to September.
Subscribe to our YouTube channel for daily crypto updates, market insights, and expert analysis.