Kaspa price is still moving sideways after losing steam from its earlier rally. Momentum is fading, technicals lean bearish, and price is hanging just above support at $0.085.
The token couldn’t push past resistance near $0.092, and since then it’s been stuck in a tight band. Right now, it’s trading around $0.08536.
Let’s walk through what’s happening today.
What you'll learn 👉
📅 What We Got Right Yesterday
In yesterday’s prediction, we talked about how important the $0.084 level is. We said that if it breaks, KAS price could slip down to $0.080 or even $0.075.
So far, buyers have kept the line, with price holding above $0.085. That’s kept the market in the same range we expected, between $0.087 and $0.092.
We also noted that only a breakout above $0.092 with volume could unlock $0.095-$0.100. That hasn’t happened yet, and KAS is still drifting sideways.
📊 Kaspa Daily Overview (August 22)
- Current Price: $0.08536
- 24h Change: -2.60%
- Volume: Low and fading
Kaspa price has been chopping around the same levels for several days now. Support sits near $0.0845–$0.0860, while $0.091 keeps rejecting upside attempts. With low volume and small candles, the market feels indecisive.
🔍 What the Kaspa Chart Is Showing
The KAS chart is shaping up like a descending triangle, lower highs pressing into flat support around $0.085. That pattern often leans bearish if buyers can’t hold the floor.
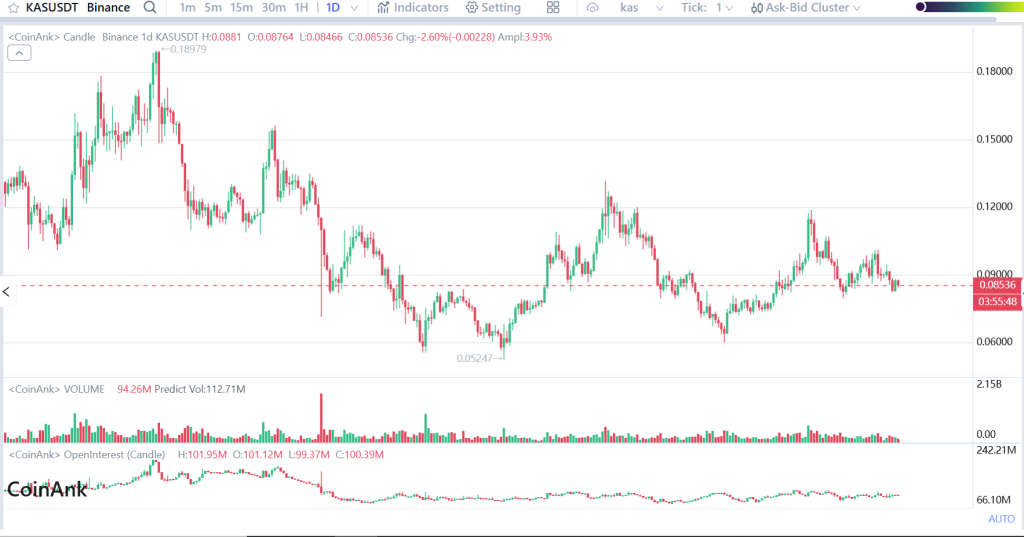
The rally off the $0.0525 low topped out near $0.11–$0.12 before rolling over. Since then, KAS price has been stuck in mid-range, with no real breakout. If $0.084 cracks, the next levels to watch are $0.081–$0.082, then $0.077–$0.078.
📈 Technical Indicators (Daily)
| Indicators | Value | Signal |
| MACD (12,26) | -0.001 | Bearish crossover, weak momentum |
| ADX (14) | 22.132 | Weak trend, mild bullish bias |
| CCI (14) | -116.20 | Bearish territory, selling pressure |
| RSI (14) | 44.67 | Weak momentum, below neutral |
| ROC | -5.602 | Negative momentum, favors sellers |
| Bull/Bear Power (13) | -0.0053 | Slight bearish dominance |
Summary: Most of the signals are on the bearish side, with sellers in control. The only positive is ADX, which shows trend strength could be building, though it’s still weak.
🔮 Kaspa Price Scenarios
Bullish:
A push above $0.092 with volume could take KAS to $0.095–$0.100. If $0.10 breaks, $0.11–$0.115 comes into play.
Neutral:
If $0.084 holds, expect more sideways trading between $0.087 and $0.092 until momentum picks up.
Bearish:
If $0.084 fails, KAS price could slide toward $0.080, with $0.075 just below as the next line of defense.
🧠 Wrapping Up
Kaspa price is sitting right on a key pivot level. Bulls would need to reclaim $0.092 in order to reverse the short-term outlook, but meanwhile the token is more likely to chop sideways or slope downward.
So far, the most likely scenario remains another day of range trading between $0.084 and $0.092, unless the breakout is followed by heavy volume.
Read Also: Is Binance Preparing to List Kaspa? Here Are the Clues
Subscribe to our YouTube channel for daily crypto updates, market insights, and expert analysis.