Kaspa price is stuck in a tight range, with bulls holding support while sellers keep pausing momentum near resistance. On the daily chart, price is compressed inside a symmetrical triangle, which more often than not ends with a breakout.
Presently, KAS is trading slightly above $0.087, but yet unable to resist above the 100-day simple moving average at $0.0906.
Let’s break down today’s setup.
What you'll learn 👉
📅 What We Got Right Yesterday
In yesterday’s prediction, we talked about how $0.087 was the key level to watch. If it gave way, the price could slip toward $0.084 or even $0.080.
So far, that support is holding up. Kaspa price is still hovering just above it, with no real breakout yet.
We also said sideways action between $0.087 and $0.092 looked likely unless volume kicked in. That’s exactly what’s playing out now.
📊 Kaspa Daily Overview (August 19)
- Current Price: $0.08793
- 24h Change: -0.35%
- RSI (14): 46.22 – Neutral, no clear momentum
Kaspa price is still bouncing along its rising support line. The range between $0.085 and $0.095 has tightened up, and unless something shifts, the price looks set to keep chopping sideways.
🔍 What the Kaspa Chart Is Showing
The Kaspa chart still shows a symmetrical triangle pattern. Buyers keep defending higher lows, but sellers are just as quick to push back at resistance.
Volume has stayed light, and candles are clustering around support, both signs of hesitation. Until Kaspa breaks out above $0.095 with strong volume, it’s hard to call this anything more than consolidation.
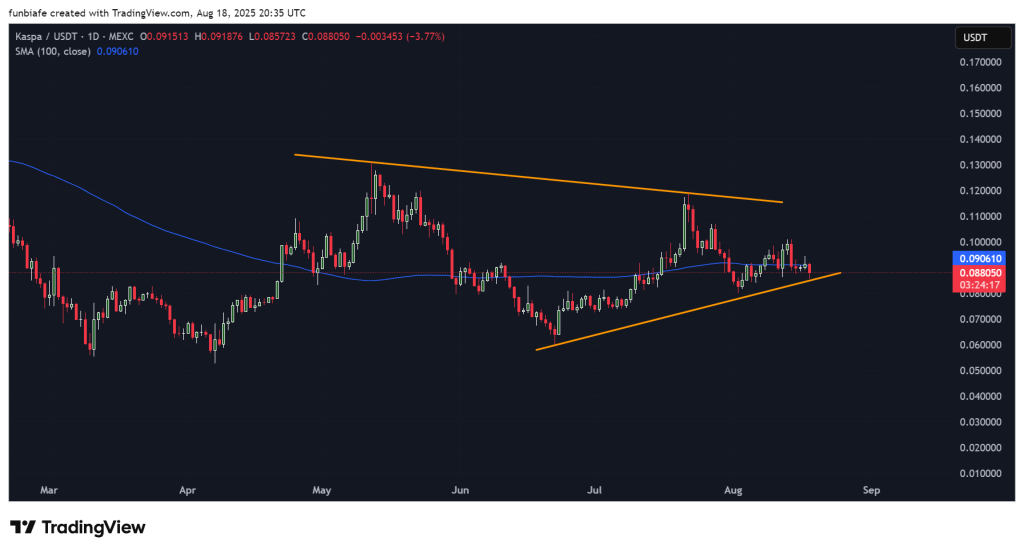
If support breaks under $0.085, then $0.084 and $0.080 are the next downside levels to watch.
📈 Technical Indicators (Daily Timeframe)
| Indicator | Value | Signal |
| MACD (12,26) | 0.001 | Weak bullish crossover |
| ADX (14) | 27.11 | Trend building, leaning bullish |
| CCI (14) | -80.59 | Bearish pressure creeping in |
| RSI (14) | 46.22 | Neutral, stuck in the middle |
| Ultimate Oscillator | -2.77 | Bearish momentum |
| Bull/Bear Power (13) | -0.0063 | Sellers still in control |
Summary: The indicators are split. MACD and ADX show early signs of bullish momentum, while CCI, Ultimate Oscillator, and Bear Power lean bearish. RSI says we’re still stuck in the middle.
🔮 Kaspa Price Prediction Scenarios
Bullish Scenario:
If KAS price bounces back from $0.087 and crosses $0.092, it can go as high as $0.095-$0.10. Crossing $0.10 would have $0.11-$0.115 lying idle.
Neutral Scenario:
Sideways action between $0.087 and $0.092 looks likely until volume sparks a breakout.
Bearish Scenario:
Closing below $0.087 on the daily chart would target $0.084, with the possibility of going down to $0.080 if selling pressure picks up.
🧠 Wrapping Up
Kaspa price is still in a waiting game. Buyers are defending support, but sellers aren’t letting it through resistance.
The most powerful short-term move is more sideways chop until the triangle is broken. Breaking above $0.095 would be bullish, while falling below $0.085 could return control to sellers.
Read Also: ChatGPT Predicts Kaspa Price Peak for This Bull Run
Subscribe to our YouTube channel for daily crypto updates, market insights, and expert analysis.