Stellar (XLM) appears to be setting up for a potentially major rally, according to a fresh chart analysis shared by Ali on X. Using data from Investing.com, Ali points to an inverse head and shoulders pattern forming on the daily chart.
This bullish setup often signals the possibility of a significant breakout if the neckline is breached. In this case, Ali notes that breaking above $0.50 could open the door for a push toward $0.77.
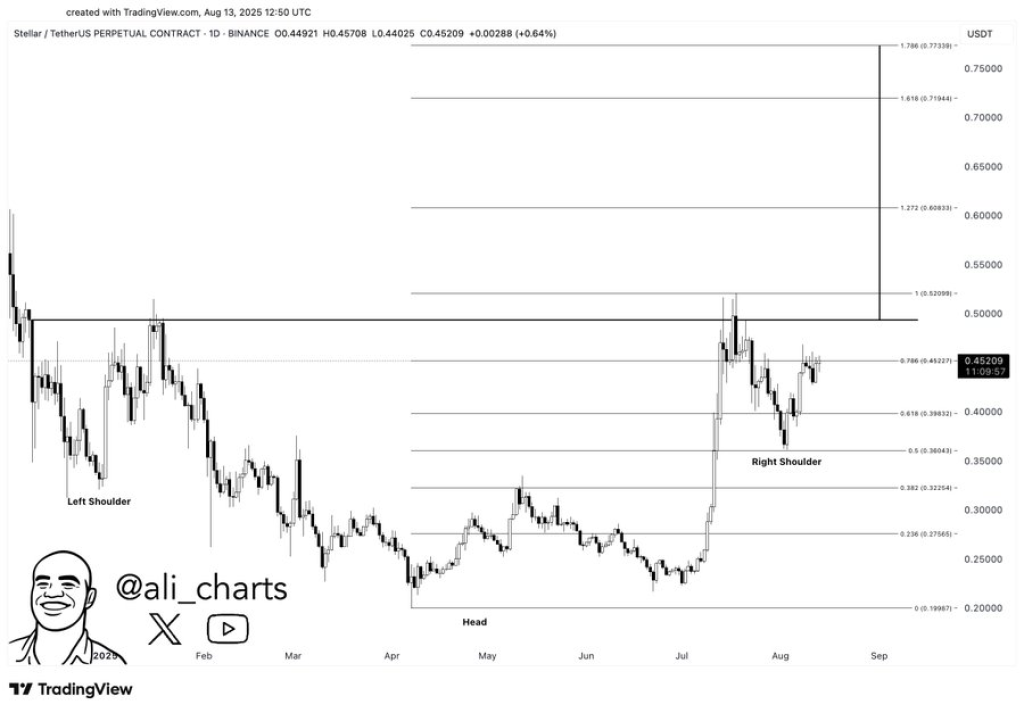
The chart shows a clear left shoulder forming earlier in the year, followed by a deeper dip to create the head in May, and then a right shoulder forming in recent weeks. Prices have been steadily climbing from the July lows and are now testing resistance near the neckline at around $0.50.
If bulls manage to secure a strong close above this level, it could confirm the pattern and trigger the next leg upward. The Fibonacci extension levels suggest possible upside targets, with the $0.60 region as the first major hurdle before aiming for the $0.70 and $0.77 areas.
XLM Daily Indicator Readings
According to the latest Investing.com readings for the daily chart, momentum is leaning strongly toward the bulls:
| Name | Value | Action |
|---|---|---|
| RSI (14) | 59.266 | In the buy zone, showing strong bullish momentum |
| STOCH (9,6) | 74.481 | Also bullish, suggesting continued upward strength |
| MACD (12,26) | 0.022 | Bullish crossover, reinforcing the positive outlook |
| CCI (14) | 91.7485 | Signaling a strong upward trend |
| Ultimate Oscillator | 41.347 | Slightly bearish, indicating some short-term caution |
The mix of indicators shows strong buying pressure dominating, with only one measure hinting at minor near-term pullbacks.
XLM Moving Averages Signal Strong Buy
The moving averages add further weight to the bullish case. The 50-day simple moving average sits at $0.37741 and the exponential at $0.39025, both flashing buy signals as the current XLM price remains above them. The 100-day averages, at $0.32603 (SMA) and $0.35152 (EMA), are also bullish, showing that medium-term momentum is firmly in the buyers’ hands.
Even on the long-term view, the 200-day SMA at $0.30873 and EMA at $0.31117 are pointing higher, suggesting that the broader trend is shifting to the upside. This alignment of short, medium, and long-term averages into a strong buy configuration often precedes sustained rallies.
Read Also: Why Chainlink (LINK) Might Outshine Every Other Altcoin This Cycle
In short, Stellar’s technical picture is leaning heavily bullish. If Ali’s key level of $0.50 gives way, the XLM price could be gearing up for an aggressive move toward $0.77, marking one of the strongest breakouts for the asset this year.
Subscribe to our YouTube channel for daily crypto updates, market insights, and expert analysis.