

Kaspa price is holding up well above short-term support after bouncing off its early August lows. The price structure has stayed bullish since late June, with a series of higher lows backed by an ascending trendline. The 30-period EMA is still pointing upward, keeping the bias positive, but that $0.10 resistance hasn’t been cracked yet.
Let’s take a closer look at today’s setup.
What you'll learn 👉
📅 What We Got Right Yesterday
Yesterday, we highlighted $0.10 as the breakout level to watch and $0.087 as the main support to hold.
So far, Kaspa price has stayed above the EMA at $0.094 and kept its bullish structure intact. As expected, buyers stepped in above $0.094, but momentum has cooled as price hovers near the $0.098–$0.10 zone.
📊 Kaspa Daily Overview (August 11)
- Current Price: $0.0946
- 24h Change: -0.84%
- 4H RSI (14): 52.25
- Volume: Steady, no major surges
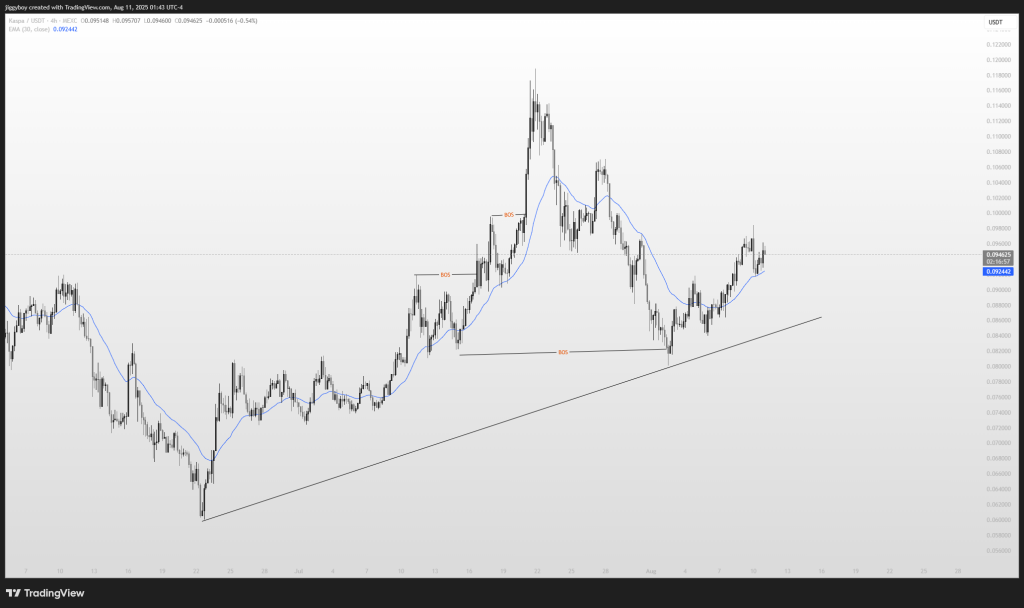
Right now, KAS price is trading in a tight range between $0.094 and $0.098. The ascending trendline from late June is still guiding the move, with $0.085–$0.087 acting as strong support underneath.
🔍 What the Kaspa Chart Is Showing
On the 4H chart, Kaspa is still showing a healthy uptrend, with multiple Break of Structure (BOS) points marking its climb. After topping at $0.122 in mid-July, the price pulled back to the trendline before recovering.
The next big test is the $0.098–$0.10 area. Breaking through could open the way to $0.105–$0.110, while another rejection might see price drift back toward $0.090 or even $0.085–$0.087.
📈 Technical Indicators (Hourly Timeframe)
| Indicator | Value | Signal |
|---|---|---|
| RSI (14) | 52.25 | Neutral momentum |
| ADX (14) | 26.05 | Trend strength building |
| MACD (12,26) | 0 | Balanced momentum |
| CCI (14) | 68.16 | Slight bullish bias |
| ROC | 1.307 | Positive short-term move |
| Bull/Bear Power (13) | 0.0016 | Small bullish edge |
Overall, the hourly indicators lean slightly bullish. The trend is picking up, but RSI and MACD show it’s not overstretched.
🔮 Kaspa Price Prediction Scenarios
Bullish:
If Kaspa can close strongly above $0.10, it would be a strong indication that the buyers are gaining control.That could push Kaspa up to around $0.105–$0.110 in the near term. If buyers keep the pressure on and trading volume increases, the rally might even stretch to $0.112–$0.120.. That would position the market in place to test the mid-July highs.
Neutral:
If $0.10 is still a ceiling, the KAS price could stay within a range pattern. If $0.10 keeps holding as resistance, the price would probably move sideways between $0.085 and $0.10 for a bit. This kind of range usually means traders are waiting for something bigger to happen before committing in either direction.
Read Also: Lido DAO (LDO) Short-Term Price Outlook For August
Bearish:
When Kaspa falls below $0.087, sellers can swoop in and drive it down to $0.084–$0.085 in a matter of minutes. Breaking that level may also trigger the decline to $0.080, which was a significant level back in June. Such a drop would break the trendline support and could change the short-term bias to the downside.
🧠 Wrapping Up
Kaspa price action is still going in the direction of higher price action, yet $0.10 is the clear hurdle to watch. For now, as long as Kaspa stays above the $0.094 EMA and the $0.085–$0.087 trendline, the advantage is still with the bulls. A close above $0.10 could shift momentum higher, while a drop under $0.087 would likely point to a deeper pullback.
Subscribe to our YouTube channel for daily crypto updates, market insights, and expert analysis.


