Kaspa price is trying to come back following a rough patch and investors are waiting to see if it can keep its momentum going.
The token is currently trading at $0.08959, up by about 5% in the past day. Price is just below the 100-day SMA, and although it’s being very kind to rebound from the new low, it still has some distance to travel before the bulls can enjoy full supremacy.
Let’s break down what’s going on with KAS today.
What you'll learn 👉
📅 What We Got Right Yesterday
In yesterday’s prediction, we highlighted the $0.082 support level as the key line in the sand for Kaspa. That call played out perfectly. KAS price dipped to around $0.08486, bounced right off that area, and formed a strong daily candle.
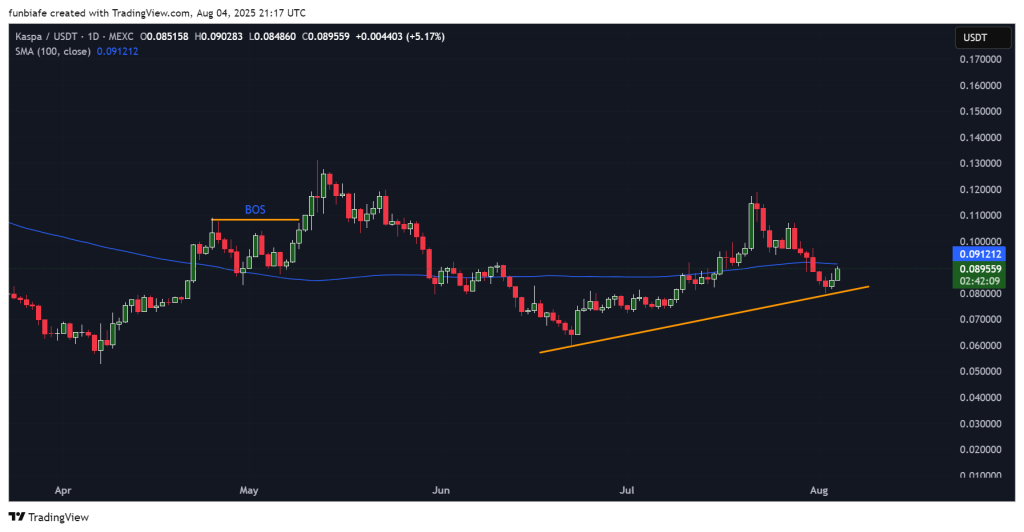
We also said the real test for bulls would come near $0.090–$0.095, where the 100-day SMA sits at $0.0912. That’s exactly where KAS is hovering now, struggling to push through but not giving up either.
📊 Kaspa Daily Snapshot (August 5)
- Current Price: $0.08959
- 24h Change: +5.17%
- Key Supports: $0.085 / $0.082
- Key Resistances: $0.0912 / $0.095 / $0.10
KAS daily chart shows a nice bounce off the ascending trendline that’s been supporting price since late June. That trendline is doing its job, but the real challenge is breaking above the 100-day SMA and the $0.095 resistance zone. If buyers can hold that, $0.10 and even $0.11 become in reach.
If, however, that trendline gets breached, then the next multiple safety nets are at $0.078 and $0.070.
📈 Technical Indicators (Daily Timeframe)
| Indicators | Value | What It Means |
| MACD (12,26) | 0 | Hinting at a possible bullish shift |
| ADX (14) | 35.12 | Strong trend, still leaning bearish |
| CCI (14) | -90.47 | Bearish pressure, almost oversold |
| RSI (14) | 47.7 | Neutral, waiting for direction |
| Ultimate Oscillator | 41.13 | Still leaning bearish |
| Bull/Bear Power (13) | -0.0069 | Bears still have a slight edge |
Summary: The indicators are mixed. MACD shows a potential turnaround, but most of the market is still leaning bearish.
🔮 Kaspa Price Prediction Scenarios
Bullish Scenario:
If KAS price breaks above $0.090–$0.0912 and holds, it could test $0.095 and even $0.10. A strong close above $0.10 could see it go towards $0.11.
Neutral Scenario:
If $0.082 stays intact, expect some sideways action between $0.082 and $0.090 while the market waits for a breakout.
Bearish Scenario:
In case $0.082 breaks down, the price can fall to $0.077, and if there is accelerating selling, then $0.070 comes into consideration.
🧠 Bottom Line
Kaspa price is trying to recover, but the market is still hesitant. It’s holding above support, yet resistance is keeping a lid on the price.
For now, a sideways chop between $0.082 and $0.090 looks most likely. A clear break in either direction will set the tone for what comes next.
Read Also: Kaspa Faces Harsh Reality in the New Crypto Game
Subscribe to our YouTube channel for daily crypto updates, market insights, and expert analysis.